Interestingly enough, based on Friday’s closing prices, overall the Amazon long is up $133, while the Overstock short is down $133. This is including commissions in the cost basis. So in essence, in a down market, the pair returned zero, which ain’t great, but I’m not going to cry over it.
Friday morning, Overstock took a hit due to the pricing of their secondary, but made up ground because the stock is thinly traded, and can be volatile. This is just cloak and dagger talk on my part, but I also think there is vested interest to keep Overstock above the secondary pricing because if Overstock traded below the secondary pricing before the secondary, then you hose the people buying the secondary.
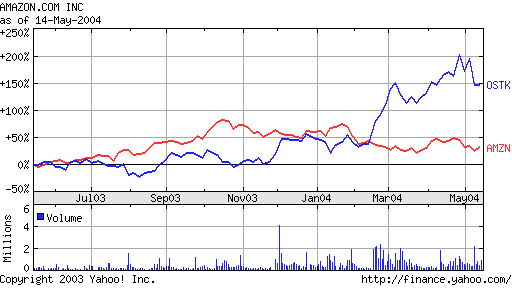
I think the best chart that captures my thinking with the Amazon/Overstock pair is this chart via Yahoo Finance showing their respective returns over the past year. Amazon and Overstock more or less tracked each other until mid February when CEO Patrick Byrne bought 620,000 shares on the open market to get back at hedge funds shorting his company’s stock. Smart move you can say. He owns 5 million shares, so if he gets a short squeeze out of it, it ups his value in paper. In this case, he spent $12 million to squeeze the shares, as of Friday, up $12 give or take. On paper, since he owns 5 million shares, his paper value went up by 5m x $12 = $60 million. If someone came up to you and said, pay me $12 million and I’ll give you $60 million back, you’d take that trade any day wouldn’t you? I certainly would. A higher stock price also allows his company to raise more money, in this case, through their secondary. Overstock is raising $36.6 million in the secondary by issuing 1.2 million shares priced at $30.50 a share. If they issued 1.2 million shares at $20 a share, they would only get $24 million.
Which brings me back to the chart. Looking at the Amazon/Overstock returns over the past year, they more or less tracked each other until mid February. In my opinion, the run up in Overstock is manufactured. Overstock is up 150% over the past year, while Amazon is up about 32% over the past year. That’s quite a spread given the relative strengths of their businesses. My thesis is that the spread between Amazon and Overstock will close.

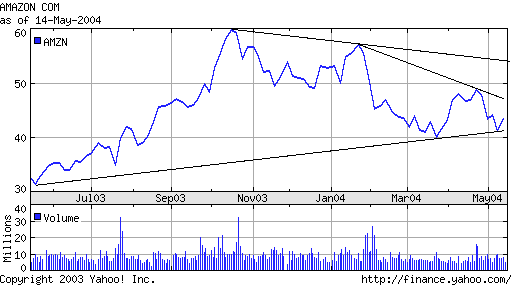
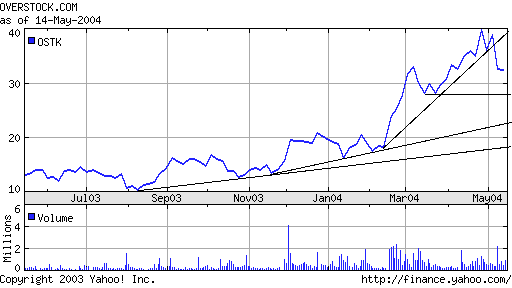
I also did some simple back of the envelope charting using my trusty Windows paint. I know I know, a little ghetto, but I like to keep things simple. It doesn’t take much to chart really, just a program that lets you draw a straight line.
Looking at its chart, Amazon seems to have found some support in the year long uptrend, around the $41 range. The last low is higher than the previous low, which is another good sign. If Amazon bounces, there’s overhead resistance around the $46 to $47 range on the trend line.

Looking at Overstock’s chart, I think the run-up is broken. I think there’s support in the 28 range since it’s where it double bottomed in March. I think there’s also support at $30 since the market likes round numbers, and the $30.50 range since they want to keep this above the secondary price. Below that, support doesn’t kick in until $22 on the trend line, and around $20 where Overstock was before the squeeze.

There is always debate over charting and whether it’s of any use. I can tell you that traders use it. And a good part of being successful in investing is to be able to guesstimate what other people want to buy or sell. A good analogy I’ve heard for investing is the TV show Family Feud where people try to guess what the most popular answer given by the crowd is. Charting is an attempt to make sense of the price action in stocks. It’s about recognizing and making sense of patterns, the simplest of which are up or down. So in that sense, it’s useful since patterns tell you what people think of a stock over a period of time. If you want to get fancy, people have come up with all sorts of patterns over the years. I tend to stick to the basics, since I find it useful. There’s also expensive software you can use to chart and screen patterns. But again, it’s worthwhile to the extent of how useful it is. Some people trade based on the charts alone. On days with no news, charting is sometimes the only thing shedding light on a stock. I tend to use charting as a validation of the investment thesis or underlying fundamentals of a company. So simple is best in my case.
At the time of writing, I am long AMZN, and short OSTK.