In my last post — President Trump’s ‘Xanatos Gambit’ Trade Policy — I spoke to how President Trump has set up his political strategy on trade policy to make any outcome on the USMCA Trade agreement that he negotiated to replace the NAFTA agreement would be to his advantage over House Democrats and the “purchased by the multi-national corporation China Lobby” GOP Senators. In this post I am going to lay out President Trump’s “Global Energy Dominance” export policy’s “Xanatos Gambit” strategy tree vis-Ã -vis the 2020 presidential elections.
To start with, I’m going to refer you back to this passage from my last post on how the Trump Administration is “gaming” economic growth measurements:
This is where Pres. Trump’s ‘Xanatos Gambit’ strategy tree kicks in via a macroeconomic and trade policy manipulation of the very simple economic equation of gross domestic product:
GDP = US ECONOMIC ACTIVITY + EXPORTS + FOREIGN INVESTMENT IMPORTS EXTERNAL INVESTMENT
The American economy just grew 3.2% in the 1st quarter of 2019. It would have grown another 0.3% but for the 30-odd day federal government shut down. The “markets” were expecting 2.5% GDP growth. The huge half-percent GDP “miss” boiled down to:
1. The USA exported more.
2. The USA imported less and
3. There was more external foreign investment than expected.
All three were the result of a combination of Trump administration policies on oil/LNG fracking, tax & regulatory cuts and trade/tariffs.
The Trump Administration upon coming into office in January 2017 had a huge windfall of energy projects that the Obama Administration had held up approval of in the Federal Energy Regulatory Commission. This windfall neither began nor ended with the Keystone XL oil pipeline. There was a whole cornucopia of oil and natural gas energy infrastructure projects that Democratic Party interests, only some of them environmental, that the Obama Administration was using the FERC to sit on for a whole lot of reasons that I refer to as “The Economic Cold Civil War.”
While the media was spending a great deal of time talking about things like the Congressional votes to open the Arctic Wildlife Refuge in the early days of the Trump Administration’s energy policy implementation. President Trump spent a great deal of his early political capital on getting his earliest political appointments through the Senate to the FERC to get those projects turned loose as a part of President Trump’s “Global Energy Dominance” export policy. The first fruit of this export infrastructure energy policy focus started paying off with the Louisiana Offshore Oil Port (LOOP) coming on-line in 2018. See this Apr 16, 2019 article by Julianne Geiger at Oilprice.com:
U.S. Doubles Oil Exports In 2018
The United States nearly doubled its oil exports in 2018, the Energy Information Administration reporting on Monday, from 1.2 million barrels per day in 2017.
The 2.0 million barrels of oil per day exported in 2018 was in line with increased oil production, which averaged 10.9 million barrels per day last year, and was made possible by changes to the Louisiana Offshore Oil Port (LOOP) which allowed it to load VLCCs (Trent Note: Very Large Crude Carriers) .
The changes to LOOP and to the sheer volume of exports were not the only changes for the US crude oil industry. The destination of this oil shifted in 2018 as well, and even shifted within the year as the trade row between China and the United States took hold.
Overall, Canada remained the largest buyer of US oil in 2018, at 19% of all oil exports, according to EIA data. During the first half of 2018, the largest buyer of US crude oil was China, averaging 376,000 barrels per day. Due to the trade row, however, US oil exports to China fell to an average of just 83,000 barrels per day in the second half, after seeing zero exports to China in the months of August, September, and October.**
[**Please note above the nice thing about energy exports is how futile a energy user embargo is against it. China’s economic embargo of US crude products only hurt itself.]
The impact of the Trump Administration’s energy export policies from those early days of his administration in terms of liquefied natural gas (LNG) export facilities are now impacting the American economy. A large part of the extra 0.7% GDP growth achieved over the 2.5% Wall Street forecasts in the first quarter of 2019 came from the Corpus Christ 1 and Sabine 5 LNG export facilities coming on-line in late 2018 and making their first full export capacity quarter in Jan – Mar 2019. The Cameroon 1 and Elba Island 1-6 LNG export facilities were also scheduled to come on-line in Late Feb-Early March 2019, and were very likely large contributors to LNG export surge.
This is how CNBC described 2019’s 1st quarter:
Robust demand for Texas oil and gas in the first two months of 2019 pushed the state’s export activity into high gear, strongly outpacing the national rate and contrasting with a slight decline by California.
Texas represented nearly 20% of all U.S. exports in the January-February period while California accounted for roughly an 11% share.
California has seen its share of total U.S. exports fall in recent years while Texas has been growing its share due mainly to the new oil boom.

And this is only the beginning for the US economy in 2019. See the following text and LNG export facility graphic from a Dec 10, 2018 report by the US Federal government’s Energy Information Administration:
U.S. liquefied natural gas export capacity to more than double by the end of 2019
U.S. LNG exports continue to increase with the growing export capacity. EIA’s latest Short-Term Energy Outlook forecasts U.S. LNG exports to average 2.9 Bcf/d in 2018 and 5.2 Bcf/d in 2019 as the new liquefaction trains are gradually commissioned and ramp up LNG production to operate at full capacity. The latest information on the status of U.S. liquefaction facilities, including expected online dates and capacities, is available in EIA’s database of U.S. LNG export facilities.
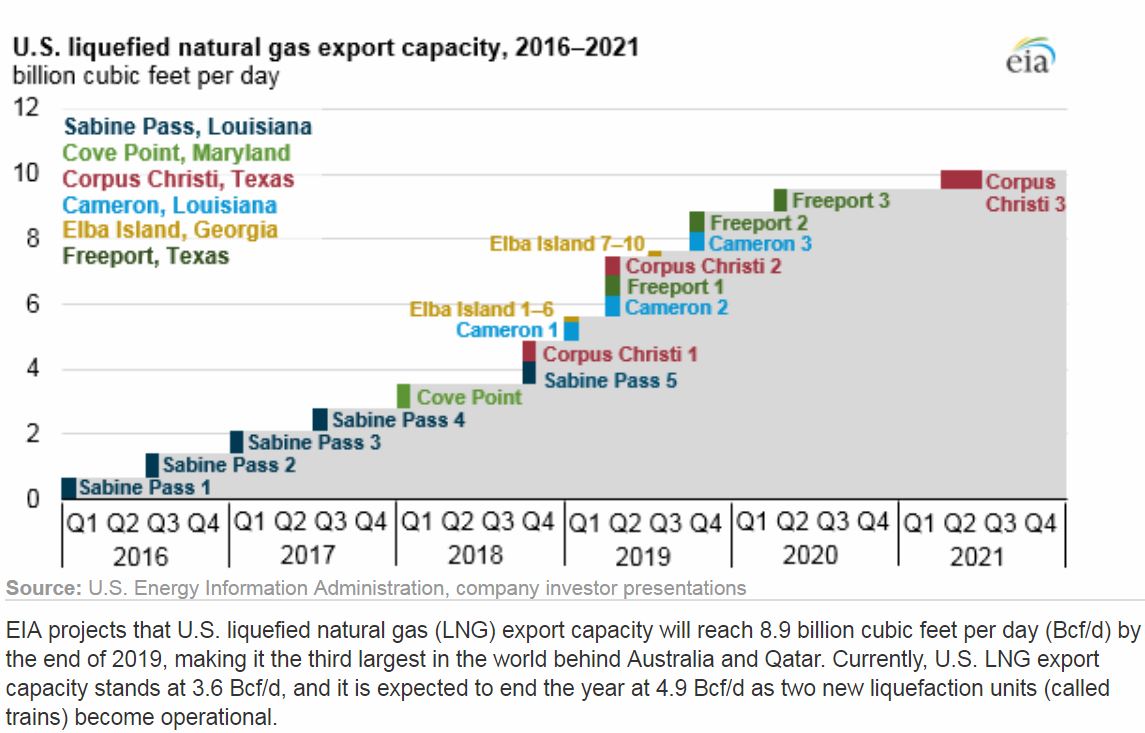
Given the above information, barring a war or serious election year intervention to kill the economy by the Federal Reserve, the cascade of LNG export infrastructure coming on-line in the 2nd and 4th quarters of 2019 will mean something on the order of a full percentage increase in GDP growth (in a range of 4.0% to 4.5%) in Jan – Mar 2020 over Jan – Mar 2019. That is what going from 3.6 billion cubic feet per day (Bcf/d) of natural gas export capacity to to 8.9 Bcf/d in Dec 2019 does for you.
This extra 1% GDP will be happening just in time for the Iowa caucuses and New Hampshire primary.
The Obama Administration, the FERC and The “Economic Cold Civil War”
Returning to a point I brought up earlier, the Obama Administration’s “Economic Cold Civil War” against US energy infrastructure. There is a lot going on here beyond narrow Democratic interest groups against the Keystone XL oil pipeline for environmental and who owns the railways exporting oil from North Dakota reasons.
Bluntly: money is power.
The rapid economic development of cheap natural gas energy and it’s associated transportation infrastructure means huge industrial development close to those supplies for America’s working classes in Red States. This means jobs, money and most importantly family development for people in states who are still majority white.
A huge but generally not discussed fact of politics is the biggest solid block of Democratic voters are single white females (SWF). The biggest conversion factor turning SWF into dependable GOP voters is getting married and having children. When there are good times for working class men. They look like good marriage prospects for working class SWF, and children producing marriage formation proceeds apace.
Here is a California versus Texas snap shot of what that cheap natural gas energy driven economic development means from CNBC:
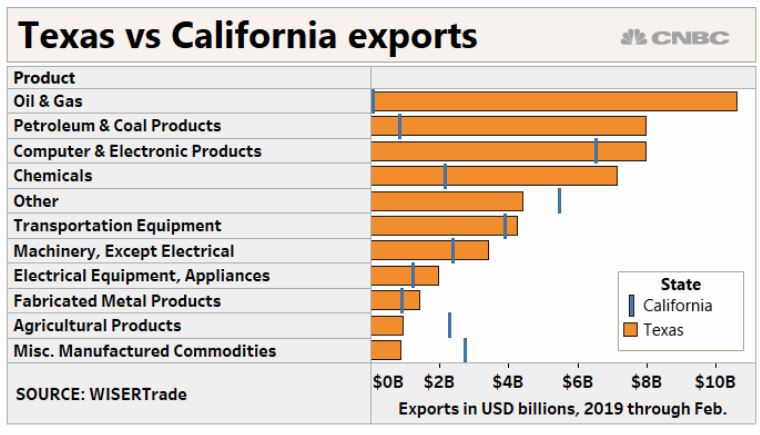
The thing that should stand out for you on that chart is how Texas is now dominating California across the board. Excluding the three of eleven energy industry driven measurements in that bar graph. Texas beats California five to three and in all the energy intensive capital goods manufacturing sectors.
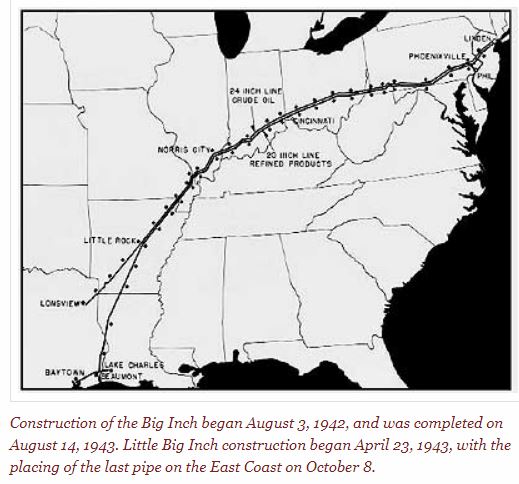
This across the board non-energy related industrial dominance reflects the cheaper energy prices in Texas. Those cheaper prices in their turn reflect energy infrastructure investment inside Texas that was outside the control of the Obama controlled FERC, due to political deals related to setting up the national power grid in the late 1930’s and early 1940’s as well as the two Texas to East Coast “Big and Little Inch” pipelines.
Thanks to the legacy of those political deals, many oil and natural gas infrastructure developments distributing energy inside Texas are outside the reach of the FERC and are the province of the elective Texas Railroad Commission. Suffice it to say that energy companies in Texas have controlled the political system in both parties (until very recently) to make the Texas Railroad Commission very friendly to energy infrastructure development.
The frac’ing revolution in Texas oil & natural gas was resulting in boom times for the white working class right before the 2020 census. This was something the Obama Administration was seeing in 2013 to 2016 and did it’s best in the FERC to slow this down both inside Texas — via the EPA’s frac’ing plus carbon emission regulations and proposed Interior Department wetlands regulatory takings of private lands — and outside Texas via the FERC.
Take a good look at this EIA map of the geographic locations LNG export facilities approved by the Trump Administration:
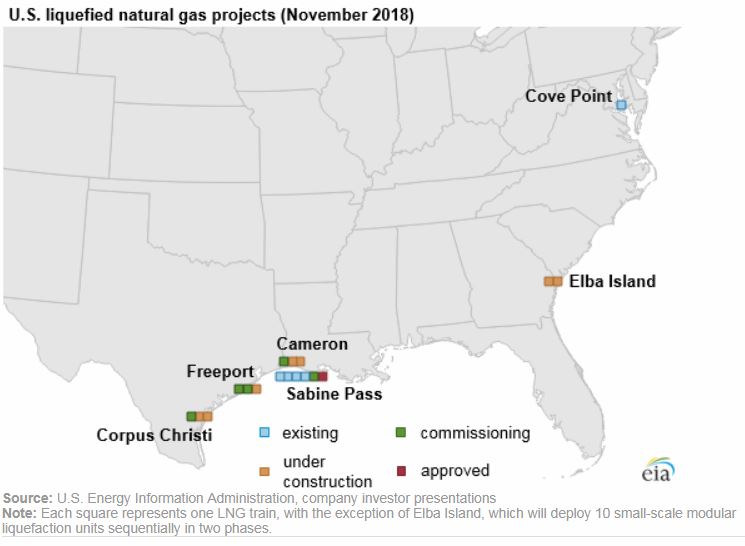
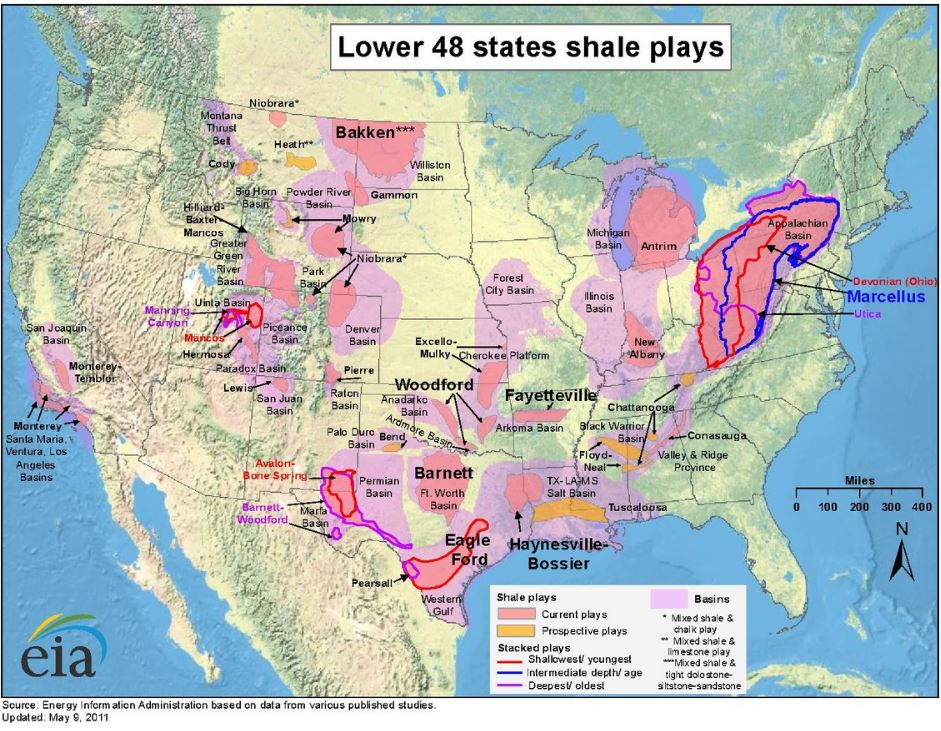
There are very sound political/economic/historical reasons that these LNG export facilities are located where they are…and some outside Texas geological ones. See this 2011 EIA map of shale deposits in the USA:
There are good reasons that the Obama Administration and one-party Democrat state governments (Illinois,
California and New York) have tried as hard as they could to strangle frac’ing.
The 2016 elections showed again that Democrats are very sparse on the ground in rural and exurban areas beyond University towns (and so are the pollsters working for Democrats ). That means rapid economic development and population growth in such areas is ignored until a lost Presidential election. It happened to Democrats in Ohio 2004. See this 2004 article:
Who Lost Ohio? – The New York Times
https://www.nytimes.com/2004/11/21/magazine/who-lost-ohio.html
And it happened again in 2016 for Trump. Frac’ing plays in Eastern Ohio and Western Pennsylvania are huge un-examined nuts and bolts poli-sci reasons why both states went Trump in 2016.
The Macro-Economics of the Trump Administration’s “America First” Economic Policies
Adding transportation infrastructure in manufacturing productivity revolution is a license to print money. The larger your efficient transportation network in a productivity revolution, the faster & larger your economy grows from the effects of economic specialization in a larger market.
.
Any evaluation of Keynesian economics that does not take into account the special economic conditions of hugely increased productivity from electrification is utter horse hockey. That especially includes economic multipliers from government spending.
.
And note, in terms of transportation infrastructure, the USA has been spending infrastructure money to remove heavy freight transportation infrastructure at an accelerating rate. The total rail line track mileage has been diving for decades, most especially in urban areas. In Texas I have seen major double track rail lines moving mile long double-decker container trains eight times a day in Houston eaten for a four lane expansion of Katy freeway. In Dallas, the city fathers are spending lots of Obama infrastructure cash to turn rail lines into BIKE PATHS!
.
Both are perfect examples of why the economic multipliers for government infrastructure spending have gone negative in America.
.
That is one of the reasons why economic downturns for the last 30 years are so tightly correlated with falling gasoline usage. When people and trucks are not driving, it is a straight line signal of reduced economic activity, because rails and water traffic are incapable of providing alternate distribution to where people live.
.Any evaluation of Keynesian economics that does not take into account the special economic conditions of hugely increased productivity from electrification is utter horse shit. That especially includes economic multipliers from government spending..
I’ve lived a lot of my youth on a lot of small town located US Army bases, which were essentially all built or upgraded in WW2. They all have an “infrastructure look” due to railway infrastructure, even after the rail lines are dug up for the scrap value of the steel rails.
.
The Dakotas and the Northern Appalachians are now both major frac’ing plays where small towns are reviving.
.
All these various places needed was someone to sit on the EPA and FERC as President Trump is doing now. And the industrial revolution that cheap natural gas and 3D printing is bringing will follow the remaining rail and river barge infrastructure to these places.
Glad to see you mentioning the importance of container freight; the great influence of this technology is too-little understood. International trade was further facilitated by better & faster telecommunications: simple e-mail could replace the useful & universal but costly & slow Telex and TWX services. Cheaper air freight, driven by wide-body jets and high-bypass engines, has also been a factor.
“Effectively the Midwestern economy was strangled in a US Government macro-economic siege driven by the Financial “Renter class” in the NY City Bond Market from 1989 onward.” But even absent any offshoring activity driven by the Financial industry, competition from manufacturers *in other countries* still would have put a major dent in American manufacturing. And today, when people on the Left call for punitive taxes on “companies that move jobs offshore”, they are ignoring the fact that…absent tariffs…the lower-priced goods that aren’t enabled by offshore cheap labor working for US-based companies will instead be enabled by offshore cheap labor working for *non-US* companies.
This is an interesting article, marred only by the unnecessary kow-tow to the Far Left media’s obfuscation of the current Democrat Party’s true ownership of the color Red — long the color of communists and socialists. Even though the media deliberately misuse the language to mock us, we do not have to go along with our own debasement. We still have the choice to stand tall and use the language properly.
The article really brings home the point that economies take a long time to react. The US decision to allow one-sided trade deals made sense in the aftermath of WWII when the US was trying to contain the Red Menace — and for many years it seemed that there was no significant costs to those one-sided deals. And when the costs eventually started to show up in de-industrialization, the Reds in the Democrat Party had moved beyond those icky people in the working class; the Democrat elite were now watermelons, Green on the outside while remaining true socialist Red on the inside — they were glad to see the mines, the steel mills, & the factories move overseas ”¦ it helped to cut pollution, you know.
Looking to the future, we can guess that the benefit US industry & the US worker is currently getting from low cost frac gas will decline in coming years. Part of this is that the Reds in the Democrat Party will continue to do everything they can to stymie the energy industry in the US, regardless of the negative impact on the US population. And part is inevitable economic harmonization — as US LNG export capacity builds, the current wide gap between gas prices in the US and the much higher gas prices in Europe will narrow, reducing the cost benefits of locating industry in the US.
“as US LNG export capacity builds, the current wide gap between gas prices in the US and the much higher gas prices in Europe will narrow”…only to a certain extent, LNG shipping by sea is expensive.
I would like too see a revival of the USA nuclear power industry. That would give us a second major energy source just in case oil eventually begins to diminish. The “hardening” of our electricity grid would also be good insurance. Long range, I hope the revival of our manufacturing base continues. China is a rival, not yet an enemy and their demographic troubles will probably hold off serious risks of war. We need to regain the ability to make things, which was sacrificed in the effort to bring China into the world trade system,
Everything Trump is doing tends, with the exception yet of nuclear, to build on these trends. There is still no confidence that Democrats and GOP elites will not try to sabotage such a revival. The next election, and the risks of vote fraud, will require vigilance. It could all still go awry,.
Yay, California! The idiots running this state seem to think that nothing can adversely affect the economy here. They apparently do not grasp the Detroit used to prosperous, too. Used to be.
What all that new LNG export infrastructure does is establish a U.S. domestic price floor natural gas and an international price ceiling natural gas players like Russia cannot go above.
It also puts international natural gas on a market basis as opposed to a power politics basis like Russia and OPEC operate with oil.
The net effect is a stronger U.S. Economy and more stable world energy supply.
What’s not to like?
Mike K.
Regards this –>
>>Everything Trump is doing tends, with the exception yet of nuclear, to build on these trends. There is still no confidence that Democrats and GOP elites will not try to sabotage such a revival.The
There is this thing called the fair maid of money.
Energy infrastructure once built won’t be immediately torn down because it’s owners will be buying politicians left right and center to keep it operational.
This is why Pres. Trump and the energy industry are doing so much so fast.
At the end of 8-years of energy driven economic growth, with high anti-China tariffs growing the domestic industrial economy, the political ground will have moved out from under the globalist elites in DC and NYC.
You can’t make people who have enjoyed the first good economy of their life time to back to a “free trade” and “open borders” policies that impoverished them.
This is as much of Pres. Trump’s political/economic/political planning as promoting working class family formation.
Mike K,
See this column. It is very much related to what I’m talking about in this post:
Washington’s Biggest Lobbyist, the U.S. Chamber of Commerce, Gets Shut Out
Chilly relations with both the White House and congressional Democrats leaves the chief advocacy group for American corporations struggling to adapt
https://www.wsj.com/articles/washingtons-biggest-lobbyist-the-u-s-chamber-of-commerce-gets-shut-out-11556812302
And note, old time newspaperman Don Surber did the head line better than the WSJ with this blog post:
Trump to Chamber: Drop dead. It did
Saturday, May 04, 2019
https://donsurber.blogspot.com/2019/05/trump-to-chamber-drop-dead-it-did.html
Pres. Trump’s FERC is busy creating more LNG infrastructure “Facts on the Ground.”
US Greenlights Two Major LNG Export Projects
Tsvetana Paraskova, Oil Price May 3, 2019
https://oilprice.com/Energy/Energy-General/US-Greenlights-Two-Major-LNG-Export-Projects.html
The U.S. Federal Energy Regulatory Commission (FERC) approved on Thursday two liquefied natural gas (LNG) projects that will add to the growing U.S. export capacity of the super-chilled fuel.
FERC approved the project for the Driftwood LNG export terminal and associated pipeline on the west bank of the Calcasieu River, south of Lake Charles, Louisiana, proposed by Tellurian, and the Port Arthur LNG facility in Texas planned by Sempra Energy.
“We look forward to beginning construction and delivering first LNG in 2023,” Tellurian’s President and CEO Meg Gentle said today, commenting on the Driftwood LNG approval.
Tellurian’s timeline for the Driftwood LNG project includes final investment decision this year, the start of construction this year, and start of operations in 2023.
>>Looking to the future, we can guess that the benefit US industry & the US worker is currently getting from low cost frac gas will decline in coming years
Umm…no.
The industrial/political/economic inertia is such that you are going to see another near doubling of US LNG export capacity by 2024, when Pres. Trump’s 2nd term as President draws to a close.
The other key developments are pipelines in Pennsylvania.
See:
7 major pipeline projects in Pennsylvania
By Candy Woodall | cwoodall@pennlive.com
https://www.pennlive.com/midstate/2015/10/7_major_pipeline_projects_in_p.html
and
Stalled Pennsylvania-New York gas pipeline could get a boost from Trump’s executive order
by Jennifer A. Dlouhy, Bloomberg, Updated: April 9, 2019
https://www.philly.com/business/trump-executive-order-boost-pennsylvania-new-york-gas-pipeline-20190409.html
The move seeks to short-circuit regulators in New York who have denied the planned pipeline a crucial permit, invoking their powers under the Clean Water Act to reject projects they deem a threat to water supplies and the environment. Other states and tribes have wielded the power to restrict a coal export terminal and hydropower project on the West Coast.
The Clean Water Act wasn’t “intended to give a state veto power,” said Dena Wiggins, president of the Natural Gas Supply Association. “The actions New York is taking not only impact New York, they are impacting the entire Northeast, because we can’t get a pipeline through the state in order to provide gas service to the Northeast.”
Trent: “… you are going to see another near doubling of US LNG export capacity by 2024 ”¦”
Exactly! And what will be the consequence of increased gas exports from the US to Europe? (Most of the LNG export facilities lead to the Atlantic, and thus to European markets currently buying Russian gas).
Per Statista, the average price of natural gas in the US in 2018 was $2.9/Million Btu (British Thermal Units); in Europe, it was $8.0/Million Btu — more than twice the US price.
Currently, North American gas consumers get the benefit of low prices because there is an excess supply of natural gas basically trapped in North America. Once there is a viable large-scale means of transporting North American gas to Europe, the US consumer will have to compete for supply with the European consumer.
When LNG exports on a large scale become practical, every US gas producer is going to want to sell his gas in Europe, where he will get a higher netback even after the cost of LNG shipping. Result will be more demand for gas in the US, and more supply in Europe. Simple economics — prices will tend to converge, with European gas prices declining and US gas prices increasing.
Effectively, as long distance transport of natural gas increases, the present physically-separated markets for gas in different parts of the world will merge into one global market. Natural gas will become more like oil, where there is a global price for oil with appropriate adjustments for transportation costs.
US gas prices may increase somewhat, but the transportation costs imply that the European cost per kwh generated or btu created will be substantially higher than that in the US…even before considering the impact of European taxes and ‘green’ policies.
Trump is clearly working to increase the incomes of ‘working people’ who have been caught in the financial doldrums, and evidence is that he is succeeding. We all wish him, and them, well on that effort. However, it’s important to consider that these higher wages will probably have a negative impact on business profit margins. These negative impacts can in most cases be overcome in time via greater capex / automation, but it won’t happen immediately.
It is wise not to put too much credence in ‘forward earnings’ and ‘forward PE’ numbers, which are really nothing other than opinions.
A stock market movement down of, say, 20% could have some serious financial & political impacts.
That Surber column was great. Eventually, the oil/gas matter will come down to whether oil/gas is a fossil fuel or whether there is another process creating it. For example, Maybe oil is not a product of ancient plant or biologic life.
Earlier studies of mantle-derived rocks from many places have shown that hydrocarbons from the mantle region can be found widely around the globe. However, the content of such hydrocarbons is in low concentration.[2] While there may be large deposits of abiotic hydrocarbons, globally significant amounts of abiotic hydrocarbons are deemed unlikely.
But what if they are there ? Saturn’s moon, Titan, has lakes of methane.
Of the hundreds of moons in our solar system, Titan is the only one with a dense atmosphere and large liquid reservoirs on its surface, making it in some ways more like a terrestrial planet.
Both Earth and Titan have nitrogen-dominated atmospheres — over 95 percent nitrogen in Titan’s case. However, unlike Earth, Titan has very little oxygen; the rest of the atmosphere is mostly methane and trace amounts of other gases, including ethane. And at the frigid temperatures found at Saturn’s great distance from the sun, the methane and ethane can exist on the surface in liquid form.
For this reason, scientists had long speculated about the possible existence of hydrocarbon lakes and seas on Titan, and data from the NASA/ESA Cassini-Huygens mission does not disappoint. Since arriving in the Saturn system in 2004, the Cassini spacecraft has revealed that more than 620,000 square miles (1.6 million square kilometers) of Titan’s surface — almost two percent of the total — are covered in liquid.
What makes the methane?
The site is acting up today
David,
The issue of labor cost is tied into productivity and energy costs.
If productivity is high enough and energy costs are lower. It’s all good.
Mike K said –>
>>The site is acting up today
The site was acting up while I was writing this post Saturday and Sunday as well.
Jonathan was informed and is monitoring the situation.
Mike, some 4 decades ago I began wondering the same thing about abiotic hydrocarbons. Even before we had the recent decade’s refinements in measuring the vastness of extra- terrestrial sources of methane and ethane in places like Titan or some of the smaller planets (Pluto is too a planet!), we knew of these existing in Jupiter’s atmosphere. One can even look up online data about the relative abundance of elements in the solar system and deep space. Oxygen and carbon, although far less present than hydrogen or helium, are much more abundant than most of the other elements.
I knew also of several extreme deep drilling projects exploring the idea of hydrocarbons percolating up from earth’s interior, that these had and thus far have negative results.
Over the decades I have asked oil-exploration type friends for educated guesses. Would make a difference in their weighting of coin toss like methods in selecting a drilling location. While none of them would take a position on my question, I note that the exploration companies seem to (my unaware of all the details) eye to have continued the practice of looking for locations that fit the biological origins of fossil fuels.
Nonetheless, I still think the abiotc origin at least an interesting even valid hypothesis. Supports some amusing economic speculations…and some very wild sci fi possibilities.
There was a shot in the 60s to drill down to the Morohorvicic discontinuity, and possibly investigate such things but Lyndon Johnson took the project away from “Global Marine Company, which had done all the preliminary work and transferred the project to his patrons at Brown and Root Construction, which had funded his political career and which built many huge projects in Vietnam.
The money was spent and more money was cut off by Congress so The Mohorovicic discontinuity was never explored. Had Johnson less corrupt, we might know more.
Trent…productivity: of course. But productivity improvements can rarely be implemented instantly. Even if the technology already exists–and there are plenty of cases where an existing technology that does not make economic sense at $11/hour labor cost would make perfect sense at $18/hour…it still takes time to decide on it, order it, get it installed, and in many cases modify the processes to use it effectively. If new technology must be developed, the time horizon is of course longer.
Energy: Big differences among industries and sub-industries as to how important this is in the cost picture. For a light assembly operation, probably not very. For a restaurant: if you have 20 employees and give them each a $2/hour raise, for 180 hours/month each, then that is $7200/month in incremental pay. It’s unlikely that reductions in electricity & gas rates could make up for that.
My focus here is on the immediate future, the year and a half until Election Day.
Mike K: “Eventually, the oil/gas matter will come down to whether oil/gas is a fossil fuel or whether there is another process creating it.”
Apparently, the Russians were very interested in the concept of abiogenic generation of oil & gas. From second hand sources, this was because hydrocarbons were found in the West Siberian Basin (the world’s largest sedimentary basin) at locations hundreds of miles from potential biogenic sources. The view of many geologists today is that West Siberian oil is indeed biogenic; it was a set of very unusual geological conditions which resulted in the oil migrating such long distances in the sub-surface before eventually accumulating in Siberian oil reservoirs.
The late Professor Gold also was interested in the generation of hydrocarbons, and explored the topic in his book “The Deep Hot Biosphere”. He postulated that there might be very large deposits of hydrocarbons at great depths, trapped below the level at which rock becomes impermeable due to the thickness of overburden. There was an attempt to test this theory by drilling at the Siljan Ring in Sweden — an ancient meteor crater where it might be possible to find evidence of those postulated hydrocarbons at shallower depth. As far as I remember, the results of the drilling were inconclusive.
Of course, using some other source of energy, we can manufacture liquid hydrocarbons, as the Germans did in WWII. In the future, we could imagine a process for making diesel (which will probably always be the most practicable fuel for mobile construction equipment) by using nuclear energy to extract carbon from the air, hydrogen from water, and synthesize hydrocarbons.
There is a key fact people seem to be missing in the current economy.
Energy prices are “high” (oil at $70 a barrel) and the US Economy is BOOMING.
In the late 1970’s oil at $35 a barrel drove the US economy into a deep recession everywhere save the oil patch in Texas, Oklahoma and Louisiana.
What the Frac’ing revolution has done is greatly expand the size of the “oil patch” such that the net effect of higher oil prices now increased the net American economic growth.
This is unprecedented…and a direct policy effect of the Trump Administration’s pro-energy export infrastructure decisions.
An interesting question ,to me at least, is whether Europe and UK will ever get to the fracking revolution. I understand that most, if not all, mineral rights in Europe are government owned and therefore subject to political pressure.
The Guardian seemed pretty certain that nothing would come of it in 2016.
Has anything changed ?
According to the CPI, a $35/bbl price in 1979 would equate to $122/bbl today.
Your point is still correct, though: the greater the ratio of production vs usage for any commodity is within any country, the less harm and the more good is done by increased prices of that commodity.
The first person I remember in connection with abiotic hydrocarbons is Thomas Gold, unfortunately, the late, an astrophysicist at Cornell.
A lot of his papers are here:
https://origeminorganicadopetroleo.blogspot.com/2011/01/thomas-gold-professional-papers.html
The earliest date seems to be 1987.
Here are some numbers for your consideration.
First via this link:
https://www.crmu.net/Files/PDF%20files/Natural%20Gas%20pdfs/How%20to%20Measure%20Natural%20Gas.pdf
Here are some frequently used units for measuring natural gas:
1 cubic foot (cf) = 1,027 Btu
100 cubic feet (1 hcf) = 1 therm (approximate)
1,000 cubic feet (1 Mcf) = 1,027,000 Btu (1 MMBtu)
1,000 cubic feet (1 Mcf) = 1 dekatherm (10 therms)
1 million (1,000,000) cubic feet (1 Mmcf) = 1,027,000,000 Btu
1 billion (1,000,000,000 cubic feet (1 bcf) = 1.027 trillion Btu
1 trillion (1,000,000,000,000) cubic feet (1Tcf) = 1.027 quadrillion Btu
To put this in context:
Ӣ 1,000 cubic feet of natural gas is approximately enough to meet the natural gas needs of an
average home (space-heating, water-heating, cooking, etc.) for four days.
Ӣ In 2004, the average American home consumed 77,900 cubic feet of natural gas (or 77.9 million
Btu). On a daily basis, the average U.S. home used 213 cubic feet of natural gas. (Source:
American Gas Association Gas Facts 2006 (with 2004 data)
”¢ Most natural gas household bills display the amount of natural gas consumed by the ‘therm’
(100,000 Btu) or in hundreds of cubic feet (100 cubic feet – 1 hcf).
Ӣ Looking at larger quantities, 1 billion cubic feet (Bcf) of natural gas is enough to meet the needs of approximately 10,000 Р11,000 American homes for one year.
Ӣ 5 trillion cubic feet of natural gas is enough to meet the needs of 5 million households for 15
years.
Natural gas prices are traded in units of a thousand cubic feet per this link:
https://www.eia.gov/dnav/ng/hist/n3035us3m.htm
And Feb 2019’s price average for that unit of measure was $4.65
Using that as a price point:
1 million cubic feet a day (MMCFD) of natural gas is worth $4,650 in America
1 billion cubic feed a day (BCFD) of natural gas is worth $4.65 million in America
1 billion cubic feet a year (BCFY) of natural gas is worth $1.69 billion in America
European natural gas prices are about 2.7 times that of the USA and there are extra costs of handling yada yada so assume the price that export LNG is sold at is only twice that of the US price.
That makes one BCFY exported worth ~$3.4 billion
And today this popped out in my data feed:
US natgas output, demand seen rising to record highs in 2019 – Reuters
https://www.reuters.com/article/us-usa-natgas-idUSKCN1SD25I
In 2020, EIA projected output would rise to 92.19 bcfd and demand would rise to 84.78 bcfd. The agency forecast U.S. net gas exports would reach 5.3 bcfd in 2019 and 7.6 bcfd in 2020, up from 2.5 bcfd in 2018. The United States became a net exporter of gas for the first time in 60 years in 2017.
EIA estimates converted to Feb 2019 market price with a times two mark up for sales to Europe
2018 — 2.5 bcfd times 365 days time $9.3 million per bcfd current EU price = $ 8.48 billion
2019 — 5.3 bcfd times 365 days time $9.3 million per bcfd current EU price = $17.99 billion
2020 — 7.6 bcfd times 365 days time $9.3 million per bcfd current EU prices = $25.79 billion
Now From this post:
Texas Fracking and the Death of Big Oil
Posted by Trent Telenko on May 15th, 2016
https://chicagoboyz.net/archives/52633.html
See this:
In 2012 the FERC said there were 13 filed applications for expansions or new facilities capable of liquefying the natural gas with a total filed capability of 16.59 bcfd. Facility construction to include all safety measures takes approximately ten years.
As far as I have been able to determine, the Obama Administration FERC has treated these LNG export infrastructure applications the same way they have the XL-Pipeline – postpone them indefinitely under the guise of pretend studies. The Cheniere Energy Inc LNG terminal application for a $5 billion Louisiana export terminal has been with the FERC for years. And a Hillary Administration would be no different.
The construction times to commissioning during the Trump Administration, to date, have been running about 2.5 years for a LNG “train” export facility.
“European natural gas prices are about 2.7 times that of the USA ”¦” ”¦ today.
We have to keep in mind the irrefutable fact that markets are dynamic. Every gas producer in the US is going to try to sell his gas to Europe, if he can — in the short-term, that means reduced gas supply in the US (gas price goes up) and more gas supply in Europe (price goes down). Result = trend towards price convergence.
What is more difficult to assess is the longer-term adjustments. One Party states in the North East of the US may eventually become proponents of developing shale gas as the US gas price rises and Far Left politicians think about tax revenues and kickbacks, increasing US gas supply and moderating the price increase. European companies which have moved energy-intensive production (eg bulk chemicals) to the US to take advantage of lower US gas prices may repatriate their businesses as the gas price increases, reducing US gas demand and therefore reducing US gas prices again.
The big imponderable is how the European will react to the inevitable failure of their unsustainable “renewable” electric generation boondoggle. They could switch to natural gas, greatly increasing European gas demand. Or they could switch to nuclear. Or they could choose to return to the Middle Ages — they are Europeans, after all.
Markets are dynamic! Lots of people have made — or lost — fortunes guessing on the direction of future energy prices.
So annoying! That Anonymous was me, again.
Here’s some interesting data on LNG shipping costs
https://www.oxfordenergy.org/wpcms/wp-content/uploads/2018/02/The-LNG-Shipping-Forecast-costs-rebounding-outlook-uncertain-Insight-27.pdf
Figure 12 shows breakeven costs for new LNG projects, including both the liquification/regasification costs and the transportation per se.
David F — On the economics of LNG liquefaction, transport, and regasification: you may be amused to learn that someone applied for a patent on a process to reduce drastically the cost of regasifying LNG when it is delivered to the gas pipeline system in the consuming country.
The concept took advantage of the well-known thermodynamic relation that the efficiency of converting heat into work depends on the temperature difference between the hot & cold ends of the thermal process. It is possible to achieve world-beating 90+% energy conversion efficiency in a nuclear power plant if the heat rejection process takes place at a very low temperature — say, for example, the -260 deg F of LNG. By co-locating a nuclear power plant and an LNG regasification plant somewhere on the coast of Europe, where the rejected heat from the nuclear plant could regasify the LNG, startling levels of energy efficiency could be achieved along with significant reductions in emissions of CO2.
As a bonus, there would be widespread explosions among Euro-Greenie heads when the permit application is submitted.
Gavin..clever idea. Should also work just fine with a non-nuclear plant that uses the steam cycle, either coal-fired or gas-fired. Maybe also with a solar-thermal plant.
Combined cycle gas can be built far faster than nuclear, at least as nuclear is now. There are major bottlenecks for nuclear-steam plants, especially the reactor vessels.
On the other hand, you could use the heat from combined cycle to gasify the LNG and condense the CO2 out of the exhaust.
Gavin, David,
Nice thought, but it won’t work.
A steam turbine plant is designed to work at a specified set of environmental conditions that correspond to condenser pressures. A nuclear plant also has a licensed reactor power limit it cannot exceed. Given the steam pressure and feedwater temperature – usually about 1000 psia and 440 F, this sets a limit for the steam flow into the turbine. The average temperature extremes for summer and winter conditions are taken into account to design the condenser and low pressure turbines exhaust stage. You do not have the same size condenser in International Falls MN that you would need in Brownsville Tx. The further south you go, the bigger the condenser. ALL steam turbines are designed to put out a guaranteed power at the highest average summertime water temperature, whether you use a cooling tower or a river/lake direct. The large condenser puts a bottom temperature on the cooling water.
There are several things that start happening at low temperatures. First, the volumetric flowrate through the last stage blades increases as the circulating water (or other cooing fluid) gets colder until the flow chokes. Overall plant efficiency and generator output increases as the circ water temperature gets cooler, until the low pressure last stages hit choked flow, after that, efficiency drops as it gets colder due to excessive subcooling of the condensate requiring more extraction steam from the turbine steam flows to get it heated back up. As an aside, extraction steam flow to the lowest pressure feedwater heater will usually double as you go from hot to cold conditions.
Due to these considerations, cryogenic cooling fluids are not a good idea in a steam cycle. You also will run into gas volume expansion problems as it rapidly heats up which would cause problems from stress on the metal. Also, in 40 years of working in power plants, have never seen a condenser that did not eventually develop leaks. With water as a coolant, it is usually from corrosion, not much from stress and all you get is dirty water in your clean water to foul heat exchangers and boilers. With cryogenic natural gas as a coolant, you’d get stress corrosion cracking, allowing explosive, flammable gas to leak into your systems.
These problems could eventually be overcome or mitigated, but the capital cost of this would negate the gains increase in cycle efficiency would bring in. There have been several attempts over the last 80 years at bottom and top cycles for steam plants. The top cycles include gas turbines which have proven successful, but took many years to get the materials to work reliably. Bottoming cycles have been developed using Freon and butane/propane as working fluids. The campus power plant at UT Austin has such a bottom cycle using Freon turbines to pump hot and cold water all over the campus for heating and cooling. It works, but is a maintenance headache and the capital cost of it ensures no one wil use to to capture more of the steam cycle exhaust heat.
The issue of the political party differences between the Democrats and Republicans in terms of Blue Island elites attack on Red area economic development were outlined for me with the 2009 Waxman-Markey Bill. Otherwise known as the The American Clean Energy and Security Act of 2009 (ACES).
This bill is why Candidate for President Trump got the full throat-ed support of the energy industry and had such a well developed energy policy upon his election.
When the Democrats went after the vital interests of the US Energy Sector with it’s carbon footprint obsession, it generated a equal and opposite reaction here in Texas and elsewhere in the wide world of 2016 American frac’ing.
See:
American Clean Energy and Security Act – Wikipedia
https://en.wikipedia.org/wiki/American_Clean_Energy_and_Security_Act
The American Clean Energy and Security Act of 2009 (ACES) was an energy bill in the 111th United States Congress (H.R. 2454) that would have established a variant of an emissions trading plan similar to the European Union Emission Trading Scheme. The bill was approved by the House of Representatives on June 26, 2009 by a vote of 219-212, but was never brought to the floor of the Senate for discussion or a vote.[1][2][3]
This is a financial blog post I copied at in 2009 because of the possible impact on the Texas Economy:
“The Daily Reckoning PRESENTS: The Waxman-Markey bill that has been making its rounds on the Hill appears to be the most expensive proposal to hit Congress since the financial crisis. Chris Mayer points out who he thinks will be the winners and losers in this legislation. Read on”¦
https://dailyreckoning.com/waxman-markey-whacks-industry/
Waxman-Markey Whacks Industry
by Chris Mayer
Gaithersburg, MD
The so-called Waxman-Markey bill snaking its way through the greasy halls of Congress looks likes the most expensive thing to hit the economy since the financial crisis began. Even the normally mild- mannered Wall Street Journal called it “one of the most ambitious efforts to re-engineer American social and economic behavior in decades, presenting risks and opportunities for a wide array of businesses from Silicon Valley to the coal fields of the Appalachians.”
First off, the stated objective of cutting carbon emissions by 83% by 2050 will go down in history as outrageous – akin to when Who drummer Keith Moon drove his Lincoln Continental into the pool at the Holiday Inn. I think members of Congress must be smoking the same thing Moon was.
To show you how patently ridiculous such a goal is, I turn to Questar’s CEO – a man with the unfortunate name of Keith Rattie. Questar is an oil and gas company. Rattie is an engineer. He has been in the business since the 1970s. He walks us through the basic math in a speech he made at Utah Valley University on April 2 called “Energy Myths and Realities.” Rattie uses Utah as an example:
“Utah’s carbon footprint today is about 66 million tons per year. Our population is 2.6 million. You divide those two numbers and the average Utahan today has a carbon footprint of about 25 tons per year. An 80% reduction in Utah’s carbon footprint by 2050 implies 66 million tons today to about 13 million tons per year by 2050. If Utah’s population continues to grow at 2% per year, by 2050, there will be about 6 million people living in our state. So 13 million tons divided by 6 million people equals 2.2 tons per person per year.
“Question: When was the last time Utah’s carbon footprint was as low as 2.2 tons per person? Answer: Not since Brigham Young and the Mormon pioneers first entered the Wasatch Valley and declared, ‘This is the place.’”
“The worst-case scenario here is that the U.S. simply won’t be making steel at some point in the future. The plants will all go to Brazil. China is already the biggest steel producer in the world.”
You can extend this math over the whole country – a growing mass of 300 million people. To meet the Waxman-Markey bill’s goals would mean we have to go back to a carbon footprint about as big as the Pilgrims’ at Plymouth Rock circa 1620.
So I think the bill is absurd. I think it is also a great blow to what is left of American industry. But who cares what I think? As the great Jeffers wrote, “Be angry at the sun for setting/ If these things anger you.” This is the way the world works. Politicians do dumb things. We have to play the ball where it is. And that means we have to figure out who wins and who loses.
Here are some thoughts along those lines”¦
Agriculture. Agriculture, for whatever reasons, is exempt from the new rules. So farmers don’t have to worry about those manure pools out back or the flatulent cows emitting methane all over God’s green meadows. Those big tractors? Burn up that diesel!
Agriculture is a winner by virtue of not losing, like a hockey team that skates to a tie.
Steel. Big loser. U.S Steel, AK Steel and even foreign steel companies with US operations all get a big kick in the family jewels on this one. Steelmaking emits all kinds of carbon dioxide. The worst-case scenario here is that the US simply won’t be making steel at some point in the future. The plants will all go to Brazil. China is already the biggest steel producer in the world. Now we just handed the country a bunch of new business.
Avoid big steel in the US.
Utilities. Mostly losers. Under the bill, utilities will have to get 12% of their electricity from renewable sources. That means they are going to spend money buying windmills and solar panels. For some of the coal utilities, this is bad news – even though they caught a break when the government made a change to let coal have carbon permits for free to start off with. Gas utilities are better off, as they emit less carbon, but since coal gets some free carbon allowances upfront, their advantage will not be as big as I made out in my letter to you a month ago. (See, the problem with writing about potential legislation is the rules change every week.)
Still, I’d avoid coal producers or coal utilities. They wear big targets on their backs and can’t do much about it, except spend a lot of money. Bad for shareholders. There may be some very good ideas on the picks-and-shovel angle for coal, though. For example, a number of companies will sell equipment to clean up coal. And of course, the solar and wind guys are big winners.
Oil refiners. Losers. This is an industry in which it is hard to make money most of the time as it is. Now, under the new bill, refineries are really screwed. Basically, they are on the hook for about 44% of US carbon emissions. They would be among the biggest buyers of carbon emission allowances. I think with one stroke of the pen, the US government just made the US refining industry that much smaller. Lots of these older refineries will just have to close. US imports for gasoline will rise.
I think the refinery industry already sees the writing on the wall. This is one reason why Valero, the biggest US refinery, has been quick to get into the politically favored ethanol business. It’s also expanding overseas.
Avoid the refineries.
Trading desks. Winners. It figures. As if the government doesn’t help financial firms enough, it is going to hand them a nice tomato in trading carbon credits. The head of Morgan Stanley’s US emission trading desk said: “Carbon, while relatively small, is a critical piece of our commodities offering.” So some financial firms with trading desks in carbon get a nice little payday.
To sum up, this is only the beginning. At the end of the day, this obsession with carbon footprints means that Americans are going to have to pay a lot more for products that use fossil fuels. It means we are going to pay a lot more for energy. Obama and his crew can draw up whatever fantasies they want, but they can’t repeal the laws of economics, which, like forces of nature, win out every time.
Regards,
Chris Mayer
for The Daily Reckoning”
President Trump’s support of energy infrastructure as President was very much due to the US Domestic Energy Industry’s acting in it’s survival interests versus the 2009 Waxman-Markey Bill and it’s successors.
This, by the way, is one of several strategic reasons why candidate for President Trump targeted Jeb Bush first.
The Bush clan was the tool of Saudi oil interests and the Trump-delivered ‘crash and burn’ of Jeb removed “Big Oil’s Man” from the GOP primaries.
This was important because the “Big Oil” multi-nationals had made peace with the environmental movement via the various carbon trading financial schemes because they acted as barrier’s to entry for small American oil players. Since “Their candidate” was gone for the GOP primaries, all they paid attention too afterwards was Hillary…their other candidate for President.
Jeb’s removal cleared the ground for the small to mid-sized US Oil and Gas domestic producers to move into the GOP primaries in a big way after “Big Oil” left.
The Democrats and the GOP Congressional Fat Cats had, respectively, no or very little idea what that meant as the new frac’ing plays powering up rural areas across the USA were not where they lived or got their campaign contribution income flow from.
Candidate for President Trump, thanks to the commercial “big data” from his casino gambling empire, was very much aware what was going on in the American economy. (There is generally a 3-to-5 year lag in the best commercial data to political data. This gap was unwittingly widened by the Obama Administration’s refusal to make available a lot of 2010 economic census data.)
The correlation of where ‘Candidate for President’ Trump was holding his 2015-to-2016 Campaign Rally’s in West Virginia, Eastern Ohio and Western Pennsylvania and that 2011 frac’ing play map I posted tell’s you “Trump knew.”
The “Blue Island” media and the Democrat Party (Yes, I’m repeating myself here) missed what was really happening given all of Candidate for President Trump’s talk about saving coal jobs.
At no point did the Blue Island elites realize whom ‘Candidate for President’ Trump’s real audience was…and they still don’t.