How Allied Planes Got Their D-Day Invasion Stripes and other “Retro-High Tech” Secrets of the Normandy Invasion

There have been literally hundreds of books and thousands of articles on the June 6th 1944 invasion of Normandy.   Almost every facet of the invasion has been examined in the last 75 years.   Yet for all that, there are simply some subjects related to the Normandy invasion that professional military historians won’t deal with.

There are a lot of reasons for this, but at it’s heart, it is simply the case many, if not most, academic military historians got into history because they didn’t want to do math.   When you start talking about bandwidth, frequency, wavelength, quartz crystal radio control, atmospheric transmissiblity, radio ducting, and how all this related to the command, control, communications and intelligence (C3I) systems of the Normandy Invasion.   When   you bring up all this “Retro-High Technology,” the vast majority run screaming from the subject.

This is a real shame as it has left out the story of how the Allies created a C3I system to control all it’s air and sea forces. Projected this C3I system across the English Channel while destroying/stunning/jamming the German C3I system. And then implanted that C3I system in France.   All the while making sure thousands of Allied fighters and anti-aircraft gunners didn’t shoot at each other or down dozens of troop laden transport planes filled with paratroopers or towing gliders, as happened in Operation Husky, the Invasion of Sicily.   It simply hasn’t been addressed.

This post is my attempt to fill this gap in the historical record by explaining the problems the Western Allies faced. The Operation’s Neptune and Overlord planning process they used to overcome them with cunning yet simple ideas like invasion stripes, and a broad brush outline of how they executed those plans.
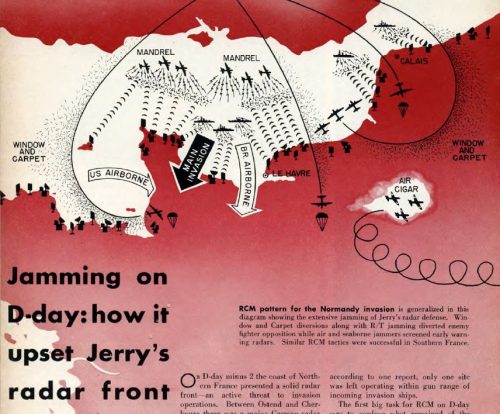
Figure 1. The Allied Operation Neptune Radar Jamming Plan for D-Day Invasion in Normandy. Source: Radar No. 6, page 10, 15 Nov 1944, Office of the Air Communications Officer, Headquarters Army Air Forces, Washington.


RETRO-HIGH TECH BACKGROUND

World War 2’s “Retro-High Tech” warfare was defined on the ground, in the air and on the sea by the use of electronic signals intelligence (SIGINT)  with the addition of RADAR for land or sea based airpower.      Both SIGINT and RADAR had to be tied together  to an effective radio and wire telecommunications network in order to provide both intelligence services the necessary data for evaluation and the military commanders the processed intelligence to act upon in order to be effective.

The effective use of RADAR required a very rapid gathering, processing, decision making and dissemination of those decisions over a vast geographic area by radio, telegraph and telephone.     During World War 2 (WW2)   RADAR networks had the addition of first radio direction finding and then “low level” signals intercepts of voice and Morse code in the clear, simple, easy to use, but quickly breakable codes — Organizations doing this were called “Y-Service” by the British — followed eventually by higher level cryptographic code breaking (or “ULTRA”) being added into this network.

This four legged stool of military sensors, communications, intelligence, and decision making by military commanders is normally referred to as Command, Control, Communications and Intelligence or “C3I”.    In particular, RADAR played the role of “Keystone Military Technology.”     And by “Keystone” I mean an analogy to the biological concept of a “Keystone species” in an ecosystem, not unlike the role of algae in the ocean ecosystem or grass for a prairie ecosystem. This military C3I ecosystem model is far more developed in the 21st century especially with the arrival of digital electronic computers — but it is simply a conceptual embellishment of this 1940’s “Revolution in Military Affairs.”

Read more

The Guadalcanal Air Campaign’s “Horseshoe Nail of Victory”

It’s damned rare, when you read the histories of the Second World War, that you can definitively find a place where one man, with the right skills, at the right place, at the right time, provided a make or break/victory or defeat   level of difference in a military campaign with his contributions.   Let alone one so central to the identities of the US Navy and US Marine Corps as the Guadalcanal campaign. Yet, for the period of September 1942 and March 1943, there was one US Marine non-commissioned officer who did just that.

He was Master Technical Sargent Dermott H. MacDonnell.   His performance as chief radar operator for Marine Air Group 23’s (MAG-23) SCR-270 radar made the difference between keeping and losing daylight air superiority over Henderson Field in the darkest days of the Guadalcanal campaign.   He was the Guadalcanal Air Campaign’s “Horseshoe Nail of Victory.”

MTSgt Dermott H. MacDonnell at base of SCR-270 radar on Guadalcanal
MTSgt Dermott H. MacDonnell at base of SCR-270 radar on Guadalcanal.   His performance with this radar won and kept air superiority in the darkest days of the Guadalcanal campaign Source:   Marine Corps Historical Archives, courtesy of MACCS History

Read more

Our ‘Xanatos Gambit’ President’s Energy Export Strategy Tree

In my last post — President Trump’s ‘Xanatos Gambit’ Trade Policy — I spoke to how President Trump has set up his political strategy on trade policy to make any outcome on the USMCA Trade agreement that he negotiated to replace the NAFTA agreement would be to his advantage over House Democrats and the “purchased by the multi-national corporation China Lobby” GOP Senators.   In this post I am going to lay out President Trump’s “Global   Energy Dominance” export policy’s “Xanatos Gambit” strategy tree vis-à-vis the 2020 presidential elections.

To start with, I’m going to refer you back to this passage from my last post on how the Trump Administration is “gaming” economic growth measurements:

This is where Pres. Trump’s ‘Xanatos Gambit’ strategy tree kicks in via a macroeconomic and trade policy manipulation of the very simple economic equation of gross domestic product:

GDP = US ECONOMIC ACTIVITY + EXPORTS + FOREIGN INVESTMENT   IMPORTS EXTERNAL INVESTMENT

The American economy just grew 3.2% in the 1st quarter of 2019.   It would have grown another 0.3% but for the 30-odd day federal government shut down.    The “markets” were expecting 2.5% GDP growth.   The huge half-percent GDP “miss” boiled down to:

1. The USA exported more.

2. The USA imported less and

3. There was more external foreign investment than expected.

All three were the result of a combination of Trump administration policies on oil/LNG fracking, tax & regulatory cuts and trade/tariffs.

The Trump Administration upon coming into office in January 2017 had a huge windfall of energy projects that the Obama Administration had held up approval of in the Federal Energy Regulatory Commission.    This windfall neither began nor ended with the  Keystone XL oil pipeline.   There was a whole cornucopia of oil and natural gas energy infrastructure projects that Democratic Party interests, only some of them environmental, that the Obama Administration was using the FERC to sit on for a whole lot of reasons that I refer to as “The Economic Cold Civil War.

While the media was spending a great deal of time talking about things like the Congressional votes to open the Arctic Wildlife Refuge in the early days of the Trump Administration’s energy policy implementation.   President Trump spent a great deal of his early political capital on getting his earliest political appointments through the Senate to the FERC to get those projects turned loose as a part of President Trump’s “Global   Energy Dominance” export policy.    The first fruit of this export infrastructure energy policy focus started paying off with the  Louisiana Offshore Oil Port (LOOP) coming on-line in 2018.    See this Apr 16, 2019 article by Julianne Geiger at Oilprice.com:

U.S. Doubles Oil Exports In 2018

The United States nearly doubled its oil exports in 2018, the Energy Information Administration reporting on Monday, from 1.2 million barrels per day in 2017.

The 2.0 million barrels of oil per day exported in 2018 was in line with increased oil production, which averaged 10.9 million barrels per day last year, and was made possible by changes to the Louisiana Offshore Oil Port (LOOP) which allowed it to load VLCCs (Trent Note: Very Large Crude Carriers) .

The changes to LOOP and to the sheer volume of exports were not the only changes for the US crude oil industry. The destination of this oil shifted in 2018 as well, and even shifted within the year as the trade row between China and the United States took hold.

Overall, Canada remained the largest buyer of US oil in 2018, at 19% of all oil exports, according to EIA data. During the first half of 2018, the largest buyer of US crude oil was China, averaging 376,000 barrels per day. Due to the trade row, however, US oil exports to China fell to an average of just 83,000 barrels per day in the second half, after seeing zero exports to China in the months of August, September, and October.**

[**Please note above the nice thing about energy exports is how futile a energy user embargo is against it.   China’s economic embargo of US crude products only hurt itself.]

The impact of the Trump Administration’s energy export policies from those early days of his administration in terms of liquefied natural gas (LNG) export facilities are now impacting the American economy. A large part of the extra 0.7% GDP growth achieved over the 2.5% Wall Street forecasts in the first quarter of 2019 came from the Corpus Christ 1 and Sabine 5 LNG export facilities coming on-line in late 2018 and making their first full export capacity quarter in Jan – Mar 2019.   The Cameroon 1 and Elba Island 1-6 LNG export facilities were also scheduled to come on-line in Late Feb-Early March 2019, and were very likely large contributors to LNG export surge.

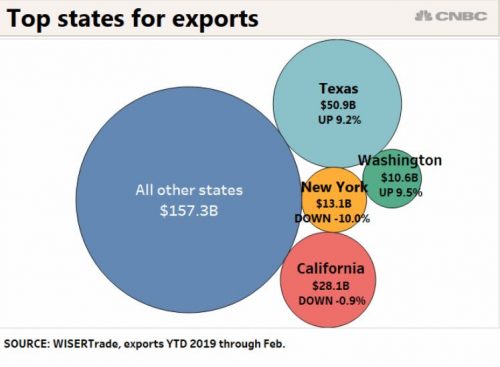
This is how CNBC described 2019’s 1st quarter:

Robust demand for Texas oil and gas in the first two months of 2019 pushed the state’s export activity into high gear, strongly outpacing the national rate and contrasting with a slight decline by California.

Texas represented nearly 20% of all U.S. exports in the January-February period while California accounted for roughly an 11% share.

California has seen its share of total U.S. exports fall in recent years while Texas has been growing its share due mainly to the new oil boom.

CNBC table of US Exports in the 1st Quarter of 2019 Source: https://www.cnbc.com/2019/04/25/texas-exports-boosted-by-oil-rise-3-times-faster-than-us-increase.html
CNBC table of US Exports in the 1st Quarter of 2019   Source: https://www.cnbc.com/2019/04/25/texas-exports-boosted-by-oil-rise-3-times-faster-than-us-increase.html

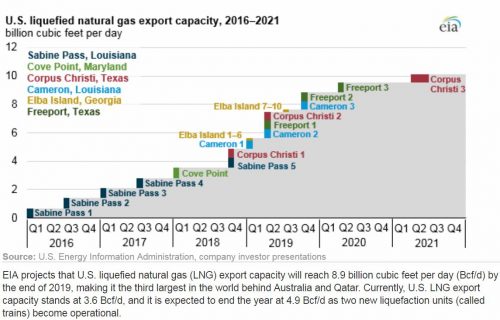
And this is only the beginning for the US economy in 2019. See the following text and LNG export facility graphic from a Dec 10, 2018 report by the US Federal government’s Energy Information Administration:

U.S. liquefied natural gas export capacity to more than double by the end of 2019

U.S. LNG exports continue to increase with the growing export capacity. EIA’s latest Short-Term Energy Outlook forecasts U.S. LNG exports to average 2.9 Bcf/d in 2018 and 5.2 Bcf/d in 2019 as the new liquefaction trains are gradually commissioned and ramp up LNG production to operate at full capacity. The latest information on the status of U.S. liquefaction facilities, including expected online dates and capacities, is available in EIA’s database of U.S. LNG export facilities.

EIA projection of Liquefied Natural Gas Export Capacity from 2016 - 2021. Date of projection Dec 2018
EIA projection of U.S. Liquefied Natural Gas Export Capacity from 2016 – 2021. Date of projection, Dec 2018.

Given the above information, barring a war or serious election year intervention to kill the economy by the Federal Reserve, the cascade of LNG export infrastructure coming on-line in the 2nd and 4th quarters of 2019   will mean something on the order of a full percentage increase in GDP growth (in a range of 4.0% to 4.5%) in Jan – Mar 2020 over Jan – Mar 2019.   That is what going from 3.6 billion cubic feet per day (Bcf/d) of natural gas export capacity to to 8.9   Bcf/d in Dec 2019 does for you.

This extra 1% GDP will be happening just in time for the Iowa caucuses and New Hampshire primary.

Read more

President Trump’s ‘Xanatos Gambit’ Trade Policy

I’ve written previously in my column “President Trump’s ‘Xanatos Gambit’ Government Shutdown” of President Trump’s tendency for building political strategy trees were every possible outcome is to his advantage. (See the “Xanatos Gambit” strategy tree example in the figure below)


https://static.tvtropes.org/pmwiki/pub/images/XanatosGambitDiagram_7509.jpg

This is a decision diagram example of a “Xanatos Gambit.  Source: https://tvtropes.org/pmwiki/pmwiki.php/Main/XanatosGambit

It very much looks like President Trump has done the same thing with the Democrats and “China lobby” GOP Senators with the post-NAFTA US-Canada-Mexico (USMCA AKA “You Smack-A”) trade agreement and the US economy.

THE US ECONOMY, NAFTA & USMACA

The key thing you need to understand regards NAFTA and American manufacturing is that NAFTA was geared to allow the “China lobby” of multinational corporations to use Canada and Mexico as an “international arbitrage opportunity” for Chinese slave labor wage manufactured goods to be assembled at Canadian and Mexican production facilities and avoid American tariffs.

Multinational corporations exploiting this “international arbitrage opportunity” was “The Great Sucking Sound” that Ross Perot talked about which killed the US domestic refined metals industry and hollowed out middle class manufacturing jobs in the American economy.

President Trump’s USMCA removes that “international arbitrage opportunity” via original 75% North American manufacturing content requirements for metals and intermediate manufacturing goods as well as a Mexican minimum wage rules on the order of $15 an hour for automotive parts assembly.

In response the “China lobby” has been paying large campaign contributions to both House Democrats and “free trade” GOP Senators to try and keep NAFTA, as well running info-war spots everywhere in the corporate media and “movement conservative” publications/media outlets about the benefits of “free trade.”   This has resulted in public statements by Speaker Pelosi that the House does not intend to vote for USMCA.

This is where Pres. Trump’s ‘Xanatos Gambit’ strategy tree kicks in via a macroeconomic and trade policy manipulation of the very simple economic equation of gross domestic product:

GDP = US ECONOMIC ACTIVITY + EXPORTS + FOREIGN INVESTMENT – IMPORTS – EXTERNAL INVESTMENT

The American economy just grew 3.2% in the 1st quarter of 2019.   It would have grown another 0.3% but for the 30-odd day federal government shut down.    The “markets” were expecting 2.5% GDP growth.   The huge half-percent GDP “miss” boiled down to:

1. The USA exported more.

2. The USA imported less and

3. There was more external foreign investment than expected.

All three were the result of a combination of Trump administration policies on oil/LNG fracking, tax & regulatory cuts and trade/tariffs.

First point, the USA will be a net energy exporter — of oil, natural gas & coal combined — in 2020 if it isn’t one already.

Some rough numbers:   In 2012 US oil production was ~8 million barrels a day, all for domestic consumption, and in 2019 it is 12.6 million with some exports.   Today’s US oil consumption is 20 million barrels a day.   That increase in oil production that has reduced imports of oil by a net of 4.6 million barrels a day has also been accompanied by the displacement of coal and oil in both electrical production and manufacturing by cheaper natural gas, thus freeing both the coal and oil not used to be exported. This combined economic change since 2012 alone is worth a 1% increase in GDP growth a year compared to 2012.

Second, the Trump administration’s systematic and sustained attack on Obama era federal regulatory growth is reducing business compliance costs particularly in the energy sector for new infrastructure projects.   These are the “anti-green” actions the Democrats accuse the Trump administration of.

Third, the Trump administration/GOP tax bill, in addition to increasing spending power for the middle class, has had a huge -YUGE- reduction in capital gains taxes and a one-time break in repatriating overseas capital holdings. This has made America a much more attractive place to hold and invest money.   Particularly for energy companies like Exxon, which are dropping this foreign capital inflow into the Permian basin for oil and natural gas fracking and energy export infrastructure from the Permian to the Gulf Coast.

Finally, in terms of trade and tariffs, President Trump’s tariffs on Chinese steel and aluminum combined with the business implications of USMCA rules have made further investment in Canadian automotive plants a net loss position.   American metal content is now economically competitive for energy sector infrastructure and automobile parts such that US Steel among others are reopening US metal plants.

Taken together every part of the GDP equation has been directly affected by the Trump administration macroeconomic policies to get that 3.2% GDP number.

This is where the Xanatos Gambit for USMCA arrives.

Things will be worse for the China lobby without a vote on USMCA than with one.

Short form:

NAFTA is dead regardless of any action or inaction by the House.   All the House and Senate can do is not vote on USMCA.   The legislative branch cannot revive a NAFTA trade agreement the federal executive has withdrawn from.

This means without a signed USMCA trade deal Pres.Trump can — and will — lay on even more tariffs on the multinational corporations playing price arbitrage in Mexico and Canada between Chinese and American manufacturing.

While such trade sanctions can reduce the American economy like a tax increase, when we are likely at close to 4% economic growth in late 2019 to early 2020 from the accumulated investment in energy projects bringing defacto energy independence,  a 3.5% economic growth rate with tariffs is still pretty good.

And when the House refuses to vote in USMCA, NAFTA still dies.

Pres. Trump can and will lay on new massive new anti-Chinese tariffs on Canadian and Mexican front companies for China without USMCA rules.   This will be massively popular in the Midwest in an election year and will hurt the income streams of the multi-nationals supporting the Pelosi Dems and McConnell RINOs.

From Trump’s point of view, What’s not to like about America’s manufacturing base employing the Midwestern white working class growing while the “international arbitrage opportunity” of  China’s slave labor economy contracts?


General MacArthur’s Bataan Gang Radio Man

One of the minor mysteries of World War II is why President Franklin Roosevelt not only ordered General Douglas MacArthur to abandon his troops in the Philippines, but went out of his way to cover up the $500,000 payment from Philippine Commonwealth President Manuel Quezon to MacArthur.

See:

MacArthur Given $500,000
By Jim Warren and
KnightRidder; Copyright (c) 1980 Lexington Herald
January 29, 1980
https://www.washingtonpost.com/archive/politics/1980/01/29/macarthur-given-500000/3ad863a3-8caa-4792-b038-d91bb3f804b4/?utm_term=.241d49fd22bd


The Secret Payment
https://www.pbs.org/wgbh/americanexperience/features/macarthur-secret-payment/

The best place for a man as difficult, politically powerful and utterly troublesome as General MacArthur is as far away from Washington, DC as possible.   What is farther away than the inside of an Imperial Japanese prison cell in Manchuria?    Yet President Roosevelt went out of his way to give the order to General MacArthur to run to Australia.

Why?

The general answer from historians like Ian Toll and  Geoffrey Perret is that MacArthur became an immensely popular heroic figure during the fall of the Philippines.   And that fact combined with the fallout from Pearl Harbor made MacArthur’s loss a political danger to the Roosevelt Administration.   This deus ex machina explanation has always been very unsatisfying to me as it’s just assumed with no underlying “why did that happen.”

It turns out there is in fact an easy explanation which the likes of Toll and Perret missed because there has never been a book-length biography of MacArthur’s chief signal officer, General Spencer Ball Akin, who was MacArthur’s “Bataan Gang Radio Man.”    

General Spencer Ball Akin

It turns out that between the beginning of the war and MacArthur’s evacuation from Corregidor, then-Colonel Akin’s radio program, “The Voice of Freedom,” was broadcast to the world, three times daily.   The Corregidor based broadcast facilities could and did reach San Francisco, California.   These radio programs were then picked up by the Hearst papers on the West Coast and later by the American radio broadcast networks.   These messages also reached Australia,   when the radio atmospherics were good, either directly or rebroadcast from America.

In the utter desert of good war news in the first months of WW2, then-Colonel Akin’s stirring propaganda broadcasts of American and Filipino resistance to the Japanese onslaught — when compared to the fall of Hong Kong, Singapore, the Dutch East Indies, plus the German Operation Drumbeat U-boat attacks off the US East Coast — was drunken down in the English speaking world like artesian spring water.

It was this turn of events shaping the publics of America and Australia that made General MacArthur’s loss to the Japanese a danger to President Roosevelt’s power as a wartime leader, thus forcing his hand to save the general he would have liked to do without.

While MacArthur’s quietest and most spectacularly talented member of his “Bataan Gang,**General Spencer Ball Akin, went on to become Chief Signal Officer of the US Army from 1947 – 1951.   Akin  never got the wider public recognition his wartime accomplishments warranted…but that was pretty much as both Generals Akin and MacArthur preferred it.

-End-


** The “Bataan Gang” refers to the 18 military personnel including General Douglas MacArthur, who were  rescued from Corregidor by four PT Boats in March 1942 and eventually traveled to Australia by B-17 Flying Fortresses and then by train to Melbourne, Australia.