Our ‘Xanatos Gambit’ President’s Energy Export Strategy Tree

In my last post — President Trump’s ‘Xanatos Gambit’ Trade Policy — I spoke to how President Trump has set up his political strategy on trade policy to make any outcome on the USMCA Trade agreement that he negotiated to replace the NAFTA agreement would be to his advantage over House Democrats and the “purchased by the multi-national corporation China Lobby” GOP Senators.  In this post I am going to lay out President Trump’s “Global  Energy Dominance” export policy’s “Xanatos Gambit” strategy tree vis-à-vis the 2020 presidential elections.

To start with, I’m going to refer you back to this passage from my last post on how the Trump Administration is “gaming” economic growth measurements:

This is where Pres. Trump’s ‘Xanatos Gambit’ strategy tree kicks in via a macroeconomic and trade policy manipulation of the very simple economic equation of gross domestic product:

GDP = US ECONOMIC ACTIVITY + EXPORTS + FOREIGN INVESTMENT – IMPORTS – EXTERNAL INVESTMENT

The American economy just grew 3.2% in the 1st quarter of 2019.  It would have grown another 0.3% but for the 30-odd day federal government shut down.  The “markets” were expecting 2.5% GDP growth.  The huge half-percent GDP “miss” boiled down to:

1. The USA exported more.

2. The USA imported less and

3. There was more external foreign investment than expected.

All three were the result of a combination of Trump administration policies on oil/LNG fracking, tax & regulatory cuts and trade/tariffs.

The Trump Administration upon coming into office in January 2017 had a huge windfall of energy projects that the Obama Administration had held up approval of in the Federal Energy Regulatory Commission.   This windfall neither began nor ended with the  Keystone XL oil pipeline There was a whole cornucopia of oil and natural gas energy infrastructure projects that Democratic Party interests, only some of them environmental, that the Obama Administration was using the FERC to sit on for a whole lot of reasons that I refer to as “The Economic Cold Civil War.

While the media was spending a great deal of time talking about things like the Congressional votes to open the Arctic Wildlife Refuge in the early days of the Trump Administration’s energy policy implementation.  President Trump spent a great deal of his early political capital on getting his earliest political appointments through the Senate to the FERC to get those projects turned loose as a part of President Trump’s “Global  Energy Dominance” export policy.  The first fruit of this export infrastructure energy policy focus started paying off with the  Louisiana Offshore Oil Port (LOOP) coming on-line in 2018.  See this Apr 16, 2019 article by Julianne Geiger at Oilprice.com:

U.S. Doubles Oil Exports In 2018

The United States nearly doubled its oil exports in 2018, the Energy Information Administration reporting on Monday, from 1.2 million barrels per day in 2017.

The 2.0 million barrels of oil per day exported in 2018 was in line with increased oil production, which averaged 10.9 million barrels per day last year, and was made possible by changes to the Louisiana Offshore Oil Port (LOOP) which allowed it to load VLCCs (Trent Note: Very Large Crude Carriers) .

The changes to LOOP and to the sheer volume of exports were not the only changes for the US crude oil industry. The destination of this oil shifted in 2018 as well, and even shifted within the year as the trade row between China and the United States took hold.

Overall, Canada remained the largest buyer of US oil in 2018, at 19% of all oil exports, according to EIA data. During the first half of 2018, the largest buyer of US crude oil was China, averaging 376,000 barrels per day. Due to the trade row, however, US oil exports to China fell to an average of just 83,000 barrels per day in the second half, after seeing zero exports to China in the months of August, September, and October.**

[**Please note above the nice thing about energy exports is how futile a energy user embargo is against it.  China’s economic embargo of US crude products only hurt itself.]

The impact of the Trump Administration’s energy export policies from those early days of his administration in terms of liquefied natural gas (LNG) export facilities are now impacting the American economy. A large part of the extra 0.7% GDP growth achieved over the 2.5% Wall Street forecasts in the first quarter of 2019 came from the Corpus Christ 1 and Sabine 5 LNG export facilities coming on-line in late 2018 and making their first full export capacity quarter in Jan – Mar 2019.  The Cameroon 1 and Elba Island 1-6 LNG export facilities were also scheduled to come on-line in Late Feb-Early March 2019, and were very likely large contributors to LNG export surge.

This is how CNBC described 2019’s 1st quarter:

Robust demand for Texas oil and gas in the first two months of 2019 pushed the state’s export activity into high gear, strongly outpacing the national rate and contrasting with a slight decline by California.

Texas represented nearly 20% of all U.S. exports in the January-February period while California accounted for roughly an 11% share.

California has seen its share of total U.S. exports fall in recent years while Texas has been growing its share due mainly to the new oil boom.

CNBC table of US Exports in the 1st Quarter of 2019 Source: https://www.cnbc.com/2019/04/25/texas-exports-boosted-by-oil-rise-3-times-faster-than-us-increase.html
CNBC table of US Exports in the 1st Quarter of 2019  Source: https://www.cnbc.com/2019/04/25/texas-exports-boosted-by-oil-rise-3-times-faster-than-us-increase.html

And this is only the beginning for the US economy in 2019. See the following text and LNG export facility graphic from a Dec 10, 2018 report by the US Federal government’s Energy Information Administration:

U.S. liquefied natural gas export capacity to more than double by the end of 2019

U.S. LNG exports continue to increase with the growing export capacity. EIA’s latest Short-Term Energy Outlook forecasts U.S. LNG exports to average 2.9 Bcf/d in 2018 and 5.2 Bcf/d in 2019 as the new liquefaction trains are gradually commissioned and ramp up LNG production to operate at full capacity. The latest information on the status of U.S. liquefaction facilities, including expected online dates and capacities, is available in EIA’s database of U.S. LNG export facilities.

EIA projection of Liquefied Natural Gas Export Capacity from 2016 - 2021. Date of projection Dec 2018
EIA projection of U.S. Liquefied Natural Gas Export Capacity from 2016 – 2021. Date of projection, Dec 2018.

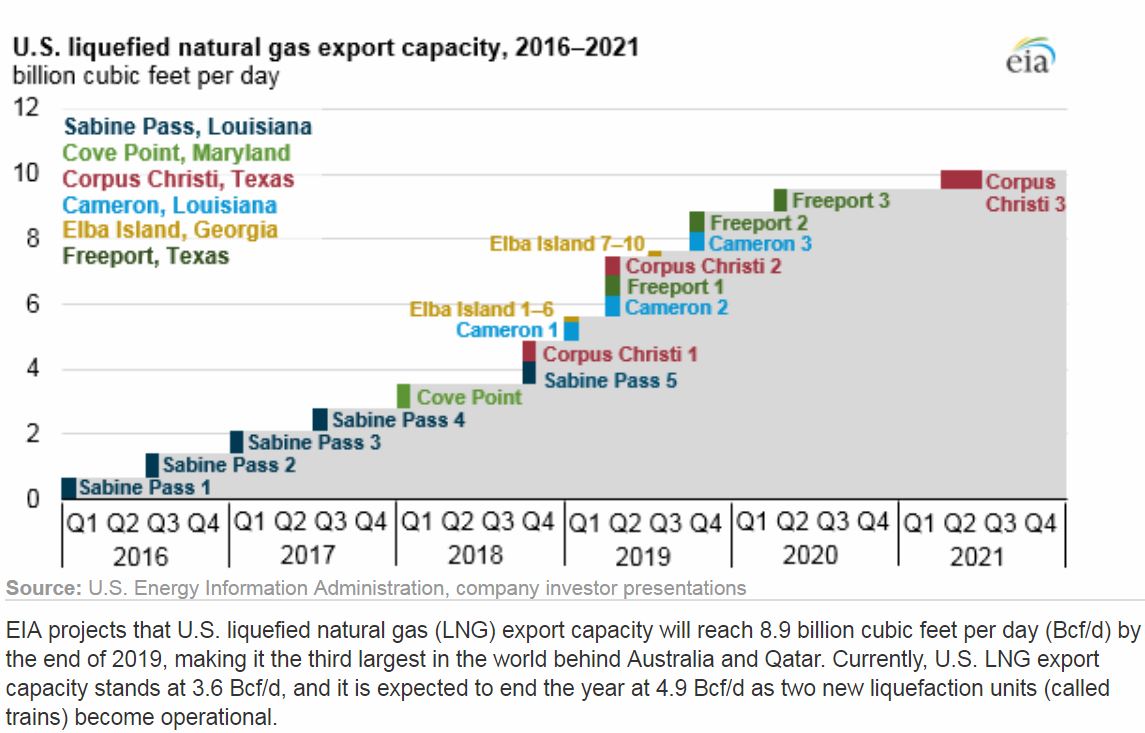
Given the above information, barring a war or serious election year intervention to kill the economy by the Federal Reserve, the cascade of LNG export infrastructure coming on-line in the 2nd and 4th quarters of 2019  will mean something on the order of a full percentage increase in GDP growth (in a range of 4.0% to 4.5%) in Jan – Mar 2020 over Jan – Mar 2019.  That is what going from 3.6 billion cubic feet per day (Bcf/d) of natural gas export capacity to to 8.9  Bcf/d in Dec 2019 does for you.

This extra 1% GDP will be happening just in time for the Iowa caucuses and New Hampshire primary.

Read more

President Trump’s ‘Xanatos Gambit’ Trade Policy

I’ve written previously in my column “President Trump’s ‘Xanatos Gambit’ Government Shutdown” of President Trump’s tendency for building political strategy trees were every possible outcome is to his advantage. (See the “Xanatos Gambit” strategy tree example in the figure below)


https://static.tvtropes.org/pmwiki/pub/images/XanatosGambitDiagram_7509.jpg

This is a decision diagram example of a “Xanatos Gambit. Source: https://tvtropes.org/pmwiki/pmwiki.php/Main/XanatosGambit

It very much looks like President Trump has done the same thing with the Democrats and “China lobby” GOP Senators with the post-NAFTA US-Canada-Mexico (USMCA AKA “You Smack-A”) trade agreement and the US economy.

THE US ECONOMY, NAFTA & USMACA

The key thing you need to understand regards NAFTA and American manufacturing is that NAFTA was geared to allow the “China lobby” of multinational corporations to use Canada and Mexico as an “international arbitrage opportunity” for Chinese slave labor wage manufactured goods to be assembled at Canadian and Mexican production facilities and avoid American tariffs.

Multinational corporations exploiting this “international arbitrage opportunity” was “The Great Sucking Sound” that Ross Perot talked about which killed the US domestic refined metals industry and hollowed out middle class manufacturing jobs in the American economy.

President Trump’s USMCA removes that “international arbitrage opportunity” via original 75% North American manufacturing content requirements for metals and intermediate manufacturing goods as well as a Mexican minimum wage rules on the order of $15 an hour for automotive parts assembly.

In response the “China lobby” has been paying large campaign contributions to both House Democrats and “free trade” GOP Senators to try and keep NAFTA, as well running info-war spots everywhere in the corporate media and “movement conservative” publications/media outlets about the benefits of “free trade.”  This has resulted in public statements by Speaker Pelosi that the House does not intend to vote for USMCA.

This is where Pres. Trump’s ‘Xanatos Gambit’ strategy tree kicks in via a macroeconomic and trade policy manipulation of the very simple economic equation of gross domestic product:

GDP = US ECONOMIC ACTIVITY + EXPORTS + FOREIGN INVESTMENT – IMPORTS – EXTERNAL INVESTMENT

The American economy just grew 3.2% in the 1st quarter of 2019.  It would have grown another 0.3% but for the 30-odd day federal government shut down.  The “markets” were expecting 2.5% GDP growth.  The huge half-percent GDP “miss” boiled down to:

1. The USA exported more.

2. The USA imported less and

3. There was more external foreign investment than expected.

All three were the result of a combination of Trump administration policies on oil/LNG fracking, tax & regulatory cuts and trade/tariffs.

First point, the USA will be a net energy exporter — of oil, natural gas & coal combined — in 2020 if it isn’t one already.

Some rough numbers:  In 2012 US oil production was ~8 million barrels a day, all for domestic consumption, and in 2019 it is 12.6 million with some exports.  Today’s US oil consumption is 20 million barrels a day.  That increase in oil production that has reduced imports of oil by a net of 4.6 million barrels a day has also been accompanied by the displacement of coal and oil in both electrical production and manufacturing by cheaper natural gas, thus freeing both the coal and oil not used to be exported. This combined economic change since 2012 alone is worth a 1% increase in GDP growth a year compared to 2012.

Second, the Trump administration’s systematic and sustained attack on Obama era federal regulatory growth is reducing business compliance costs particularly in the energy sector for new infrastructure projects.  These are the “anti-green” actions the Democrats accuse the Trump administration of.

Third, the Trump administration/GOP tax bill, in addition to increasing spending power for the middle class, has had a huge -YUGE- reduction in capital gains taxes and a one-time break in repatriating overseas capital holdings. This has made America a much more attractive place to hold and invest money.  Particularly for energy companies like Exxon, which are dropping this foreign capital inflow into the Permian basin for oil and natural gas fracking and energy export infrastructure from the Permian to the Gulf Coast.

Finally, in terms of trade and tariffs, President Trump’s tariffs on Chinese steel and aluminum combined with the business implications of USMCA rules have made further investment in Canadian automotive plants a net loss position.  American metal content is now economically competitive for energy sector infrastructure and automobile parts such that US Steel among others are reopening US metal plants.

Taken together every part of the GDP equation has been directly affected by the Trump administration macroeconomic policies to get that 3.2% GDP number.

This is where the Xanatos Gambit for USMCA arrives.

Things will be worse for the China lobby without a vote on USMCA than with one.

Short form:

NAFTA is dead regardless of any action or inaction by the House.  All the House and Senate can do is not vote on USMCA.  The legislative branch cannot revive a NAFTA trade agreement the federal executive has withdrawn from.

This means without a signed USMCA trade deal Pres.Trump can — and will — lay on even more tariffs on the multinational corporations playing price arbitrage in Mexico and Canada between Chinese and American manufacturing.

While such trade sanctions can reduce the American economy like a tax increase, when we are likely at close to 4% economic growth in late 2019 to early 2020 from the accumulated investment in energy projects bringing defacto energy independence, a 3.5% economic growth rate with tariffs is still pretty good.

And when the House refuses to vote in USMCA, NAFTA still dies.

Pres. Trump can and will lay on new massive new anti-Chinese tariffs on Canadian and Mexican front companies for China without USMCA rules.  This will be massively popular in the Midwest in an election year and will hurt the income streams of the multi-nationals supporting the Pelosi Dems and McConnell RINOs.

From Trump’s point of view, What’s not to like about America’s manufacturing base employing the Midwestern white working class growing while the “international arbitrage opportunity” of China’s slave labor economy contracts?


Freezing in the Dark

There has been much concern about possible hacking of the power grid by Russia, China, and others.  Here we have a segment from Rachel Maddow, inspired by a threat analysis from the US Intelligence Community.  From the analysis:

China has the ability to launch cyber attacks that cause localized, temporary disruptive effects on critical infrastructure–such as disruption of a natural gas pipeline for days to weeks–in the United States. Russia has the ability to execute cyber attacks in the United States that generate localized, temporary disruptive effects on critical infrastructure.

Maddow:  It’s like negative 50 degrees in the Dakotas right now. What would happen if Russia killed the power today?  What would happen if all the natural gas lines that service Sioux Falls just poof on the coldest day in recent memories?

What would happen?  Nothing good.  These are serious threats, and I doubt that Russia and China are or will continue to be the only entities able to conduct such cyberattacks.  And there is also plenty of risk for non-cyber attacks…physical-world sabotage…which could have similarly malign impact on energy infrastructure.

But we don’t need to wait for a foreign adversary or domestic terrorist organization to cripple our energy infrastructure.  We can quite effectively do it to ourselves.

In late January, it was very cold in Minnesota.  And there wasn’t a lot of wind.  Natural gas, also, was in short supply, as a result of pipeline capacity constraints.  Xcel Energy urged its gas customers to turn down thermostats and water heaters, and to use electric heaters as necessary.  The electricity was coming from primarily coal plants (40 GW) and natural gas plants (about 23 GW)–the gas plants, of course, are also dependent on pipeline capacity.

Also in Minnesota, here’s a large solar farm covered with snow.  Wonder if it’s melted or been swept off yet?  And here’s a cautionary story from Germany, where long, still, and dim winters do not mix well with wind and solar power generation.

Solar and wind in most parts of the US are now small enough in proportion to overall grid capacity that shortfalls can be made up by the other sources.  What happens if they come to represent the majority of the grid’s power capacity–not to mention the exclusive source of capacity, as demanded by some?

It may be feasible to store a few hours of electricity without driving costs out of sight…but what about the situation in which wind and solar are underperforming for several days in a row?  Interconnection of sources and demands over a wide area (geographical diversity) can help, but is by no means a comprehensive solution. So far, the gas, coal, and hydro plants have been there to kick in where necessary.

Almost every day, there are assertions that new solar is cheaper than its fossil-fuel equivalents.  This may be true in some areas if you ignore the need to match supply and demand on an instantaneous basis.  But if the fossil-fuel plants are there to handle only those periods when wind, solar, and limited battery storage aren’t sufficient to meet demand, then the total energy production against which their capital cost is charged will be much lower, and hence, the cost per unit will go up. (See the California Duck Must Die for a nice visual portrayal of how widespread solar adoption has changed the load curve for the other sources.)  In some states with net metering, a home or business owner can sell excess power to the grid when loads are low and buy it back at the same unit price when loads are at their maximum. This becomes especially problematic when “renewables” become a major part of the mix.  Unless incentives are intelligently crafted–unlikely, given politics–“renewable” sources will effectively be subsidized by conventional sources and potentially make the construction and maintenance of those conventional sources impossible.  See If Solar and Wind Are So Cheap, Why Do They Make Electricity So Expensive?

Read more

Industrial Electrification and the Technological Illiteracy of the US Army Air Corps Tactical School 1920-1940

This blog post on “Industrial Electrification and the Technological Illiteracy of the U.S. Army Air Tactical School 1920-1940” marks the new year with a departure from past history columns I’ve written for Chicagoboyz in that it is exploring a theme I refer to as “The Bane of Technologically Illiterate Military Leaders.”[1] As such, it will not be fully fleshed out with sources and notes.  Consider it a ‘first draft’ of an article I’ll post later.

The issue with ‘Technologically Illiterate Military Leaders‘ I’ll be exploring in this and future articles is that such leaders tend to make the same classes of mistakes over and over again.  And when those military leaders reach flag rank on the bones of theories and doctrines that fail the test of combat through their technological illiteracy.  They then bury the real reasons why those doctrines failed behind walls of jargon and classification to avoid accountability for those failures.

Where you can see this pattern most easily in the historical record is with the US Army Air Corp Tactical School (ACTS) “Industrial Web” theory of strategic bombing  and it’s inability to understand what the changes that industrial electrification caused had meant to this theory.  The “Industrial Web”  theory stated there were “choke points” in an industrial economy which bombing would cause a disproportionate reduction in enemy nation’s weapons production supporting total war.[2]

Figure 1 — This is an example of early industrial age direct mechanical power transmission that was replaced by small electric motor powered tooling in the 1920 to 1940 time period. The US Army’s Air Corps Tactical School (ACTS) early 1930’s era “Industrial Web” theory of strategic bombing was built upon this technological paradigm. Many of the failures of the World War 2 Combined Bomber Offensive can be laid at the feet of Western military leaders illiteracy of what the move to electric motor power, and away from this technology, meant to the vulnerabilities of industrial economies. Source: Wikipedia

On the surface, this was a logical sounding intellectual construct.  In practice, it failed miserably at places like the 14 October 1943 second Schweinfurt raid on German ball bearing factories and the  Yawata Strike,  the start of the early B-29 campaign on Japanese Coke ovens.

The unavoidable, in hindsight, issue for USAAF leaders trained in the Air Corps Tactical School in the period between 1920 and 1940 was that it spanned the change in industrial infrastructure from steam engine, line shaft and power belt to electric motor powered mass production.[3]  Thus the ACTS theorists had a fundamentally flawed understanding of industrial economies vulnerability to aerial bombing going into World War 2 (WW2) because they were technologically illiterate regards the radical change industrial electrification caused.

This flawed understanding was that roof damage in a factory with line shaft and drive belt power transmission — whether steam or electric driven — stops all production until the roof-mounted line shaft is re-seated or replaced.  This was not the case for electric motor delivered power located on the factory floor.  The technological illiteracy here was not seeing the fact that electric motors fundamentally disassociated factory production processes from factory physical structure. [4]

The basic idea that ACTS theorists had at the time was that their “Industrial Web” was a serial system where every component had to work to produce an effect.  Thus ACTS theorists fundamentally believed in the “weak link” theory of reliability, rather than the need to obliterate all key components that a parallel, or complex serial/parallel system, with redundancy required.   The point failure weakness of line shaft and drive belt industrial infrastructure fit this “serial system with a weak link” belief system of ACTS theorists to a tee. [5]

So when you read wartime USAAF bomb damage assessment reports from the WW2  Combined Bombing Campaign giving such and such percentages of factory roof’s destroyed being used as a means of determining whether production there was knocked out.  You are seeing a “weak link” short hand based upon line shaft power transmission infrastructure assumptions.

When you read later post-war bomb damage surveys reading  “…that machines and machine tools were damaged far less severely than factory structures,” you are seeing a USAAF staffer dodging those pre-WW2 “Industrial Web/Weak Link” line shaft infrastructure assumptions by not using the term at all.

This sort of language shift to hide real world meanings with jargon, thus neatly avoiding accountability for failure in combat, is one of the classic ‘poker tells’ in researching ‘Technologically Illiterate Military Leaders‘.

Read more

A Retrotech Adventure

The Essex Steam Train and Riverboat leases 22 miles of railroad track from the state of Connecticut, and owns several steam and diesel locomotives plus various rolling stock. They operate regular passenger excursions plus seasonal specials.  Essex also offers a training and experience program for people who would like to learn a little bit about operating a steam locomotive.  Being interested in steam power, I signed up.

The program includes some written material to be reviewed at home, a group classroom session of about an hour, and then an individual hour operating a locomotive under the guidance of an experienced engineer.

On arriving, I was surprised at the scale of the operation.  Although I was there in the off season (early November), judging by the parking lot and the number of railcars the place must be quite busy during prime months.  First was the class, which covers safety rules and basic steam locomotive principles.  It was taught by the railroad’s machinist, who described himself as the “spare parts department.”  Next was a group visit to the locomotive cab to familiarize ourselves with the layout of controls and indicators.

For our group, the locomotive was #40, a Mikado type built in 1920.  (The name “Mikado” became popular because an early batch of locomotives of this type was sold to the Japanese Railways.)  #40 started its life hauling logs and lumber in the West, then pulled passenger and freight trains in North Carolina until it was retired circa 1950…purchased by the Essex for restoration in 1977.  The locomotive has a rated boiler pressure of 180 psi and can generate a tractive effort of 35,000 pounds.

On a steam locomotive, the cutoff point of steam admission to the cylinders can be controlled by the engineer.  Early cutoff lets the steam do more of its work expansively, improving fuel economy at the cost of some reduction in power.  The reverser sets the cutoff point as well as controlling the direction of travel–while the reversers on early locomotives were manually-operated and required considerable strength to operate (and sometimes led to broken arms), the reverser on #40 is a fingertip control, using air pressure to do the hard work.

It was a drizzly and somewhat chilly day, but very comfortable in the locomotive cab. (The boiler backhead is very hot, do not touch!)  Basic controls and indicators include the throttle, the reverser, the boiler pressure gauge, the injectors, the boiler water glass, and the brakes with their associated pressure gauges.

Read more