In the wake of Ebola, NVD-68, and Zika, we should have all learned our lesson by now. We haven’t. This is 2020—Iowans took a week to count the votes of 5% of their population, and an elderly white Northeastern president is principally opposed by a gaggle of downright ancient white Northeasterners. There aren’t any quick fixes for emergent idiocies like those, but a few simple heuristics will go a long way toward avoiding panic over coronavirus.
Predictions
Silly Games
I swear, every time I think we have reached peak stupid, reality says “Hold my beer and watch this!” The ruckus this past weekend over cadets at the Army-Navy game appearing on live camera making a variant of the “OK” gesture now has elements of the national media, as well as authorities at the two service academies plain old coming unglued. And this is because this gesture is somehow supposed to be associated with so-called ‘white power’/ racial superiority. Great has been the twitter-tornado launched by the particularly clueless activists who happened to notice the upside-down OK gesture; I can only imagine the numbers of boggarts, ghouls and haunts which are currently living under their own beds and in their closets.
The Unspeakable in Pursuit of the Inedible
For some peculiar reason, the political commentariat this week are bending their bulging brains towards the question of which one of the progressive Democrats currently angling for a presidential bid next year will catch the brass ring. We have a year and a few days to go until Election Day, 2020, and nine months until the Democrat Party convention when the final decision on a candidate will be made; I speculate that the fierce urgency of defeating Orange Man Bad has a lot to do with so many hopefuls running early and often, and the overwhelming media interest in their assorted prospects.
I can’t claim ownership of a finely-tuned predictive crystal ball, or have any informants within the inner party, but I have been following the political scene as reflected in the crazy-house mirror of the internet since about 2002, and before that through a variety of print publications, and over time one does develop a sense of how things may develop with regard to next years’ presidential campaign.
When the Saxon Began to Hate
It was not part of their blood,
It came to them very late,
With long arrears to make good,
When the Saxon began to hate.
I have often jokingly wished that some kind of secret sign existed, like a Masonic emblem or peculiar handshake by which those of us conservatives who do not go about openly advertising our political affiliations to all and sundry might discretely identify a kindred spirit. Those of us in the real world have friends, neighbors, and co-workers who range across the political spectrum; Traditional good manners and consideration for those who didn’t share your beliefs once dictated a degree of ambiguity regarding political leanings, sexual orientation, and religious beliefs. This sense of discretion owed more to conventional good manners rather than cowardice, although a disinclination about being bashed about the head by a member of the Klantifa, harassed out of a restaurant, or a Twitter campaign to get one fired from employment are lately a very real possibility as a result of overtly advertising ones’ conservative sympathies.
Our ‘Xanatos Gambit’ President’s Energy Export Strategy Tree
In my last post — President Trump’s ‘Xanatos Gambit’ Trade Policy — I spoke to how President Trump has set up his political strategy on trade policy to make any outcome on the USMCA Trade agreement that he negotiated to replace the NAFTA agreement would be to his advantage over House Democrats and the “purchased by the multi-national corporation China Lobby” GOP Senators. In this post I am going to lay out President Trump’s “Global Energy Dominance” export policy’s “Xanatos Gambit” strategy tree vis-Ã -vis the 2020 presidential elections.
To start with, I’m going to refer you back to this passage from my last post on how the Trump Administration is “gaming” economic growth measurements:
This is where Pres. Trump’s ‘Xanatos Gambit’ strategy tree kicks in via a macroeconomic and trade policy manipulation of the very simple economic equation of gross domestic product:
GDP = US ECONOMIC ACTIVITY + EXPORTS + FOREIGN INVESTMENT IMPORTS EXTERNAL INVESTMENT
The American economy just grew 3.2% in the 1st quarter of 2019. It would have grown another 0.3% but for the 30-odd day federal government shut down. The “markets” were expecting 2.5% GDP growth. The huge half-percent GDP “miss” boiled down to:
1. The USA exported more.
2. The USA imported less and
3. There was more external foreign investment than expected.
All three were the result of a combination of Trump administration policies on oil/LNG fracking, tax & regulatory cuts and trade/tariffs.
The Trump Administration upon coming into office in January 2017 had a huge windfall of energy projects that the Obama Administration had held up approval of in the Federal Energy Regulatory Commission. This windfall neither began nor ended with the Keystone XL oil pipeline. There was a whole cornucopia of oil and natural gas energy infrastructure projects that Democratic Party interests, only some of them environmental, that the Obama Administration was using the FERC to sit on for a whole lot of reasons that I refer to as “The Economic Cold Civil War.”
While the media was spending a great deal of time talking about things like the Congressional votes to open the Arctic Wildlife Refuge in the early days of the Trump Administration’s energy policy implementation. President Trump spent a great deal of his early political capital on getting his earliest political appointments through the Senate to the FERC to get those projects turned loose as a part of President Trump’s “Global Energy Dominance” export policy. The first fruit of this export infrastructure energy policy focus started paying off with the Louisiana Offshore Oil Port (LOOP) coming on-line in 2018. See this Apr 16, 2019 article by Julianne Geiger at Oilprice.com:
U.S. Doubles Oil Exports In 2018
The United States nearly doubled its oil exports in 2018, the Energy Information Administration reporting on Monday, from 1.2 million barrels per day in 2017.
The 2.0 million barrels of oil per day exported in 2018 was in line with increased oil production, which averaged 10.9 million barrels per day last year, and was made possible by changes to the Louisiana Offshore Oil Port (LOOP) which allowed it to load VLCCs (Trent Note: Very Large Crude Carriers) .
The changes to LOOP and to the sheer volume of exports were not the only changes for the US crude oil industry. The destination of this oil shifted in 2018 as well, and even shifted within the year as the trade row between China and the United States took hold.
Overall, Canada remained the largest buyer of US oil in 2018, at 19% of all oil exports, according to EIA data. During the first half of 2018, the largest buyer of US crude oil was China, averaging 376,000 barrels per day. Due to the trade row, however, US oil exports to China fell to an average of just 83,000 barrels per day in the second half, after seeing zero exports to China in the months of August, September, and October.**
[**Please note above the nice thing about energy exports is how futile a energy user embargo is against it. China’s economic embargo of US crude products only hurt itself.]
The impact of the Trump Administration’s energy export policies from those early days of his administration in terms of liquefied natural gas (LNG) export facilities are now impacting the American economy. A large part of the extra 0.7% GDP growth achieved over the 2.5% Wall Street forecasts in the first quarter of 2019 came from the Corpus Christ 1 and Sabine 5 LNG export facilities coming on-line in late 2018 and making their first full export capacity quarter in Jan – Mar 2019. The Cameroon 1 and Elba Island 1-6 LNG export facilities were also scheduled to come on-line in Late Feb-Early March 2019, and were very likely large contributors to LNG export surge.
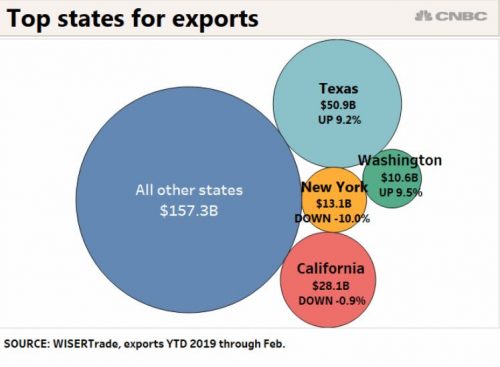
This is how CNBC described 2019’s 1st quarter:
Robust demand for Texas oil and gas in the first two months of 2019 pushed the state’s export activity into high gear, strongly outpacing the national rate and contrasting with a slight decline by California.
Texas represented nearly 20% of all U.S. exports in the January-February period while California accounted for roughly an 11% share.
California has seen its share of total U.S. exports fall in recent years while Texas has been growing its share due mainly to the new oil boom.

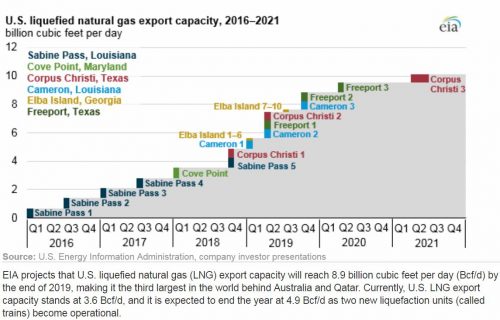
And this is only the beginning for the US economy in 2019. See the following text and LNG export facility graphic from a Dec 10, 2018 report by the US Federal government’s Energy Information Administration:
U.S. liquefied natural gas export capacity to more than double by the end of 2019
U.S. LNG exports continue to increase with the growing export capacity. EIA’s latest Short-Term Energy Outlook forecasts U.S. LNG exports to average 2.9 Bcf/d in 2018 and 5.2 Bcf/d in 2019 as the new liquefaction trains are gradually commissioned and ramp up LNG production to operate at full capacity. The latest information on the status of U.S. liquefaction facilities, including expected online dates and capacities, is available in EIA’s database of U.S. LNG export facilities.

Given the above information, barring a war or serious election year intervention to kill the economy by the Federal Reserve, the cascade of LNG export infrastructure coming on-line in the 2nd and 4th quarters of 2019 will mean something on the order of a full percentage increase in GDP growth (in a range of 4.0% to 4.5%) in Jan – Mar 2020 over Jan – Mar 2019. That is what going from 3.6 billion cubic feet per day (Bcf/d) of natural gas export capacity to to 8.9 Bcf/d in Dec 2019 does for you.
This extra 1% GDP will be happening just in time for the Iowa caucuses and New Hampshire primary.