Some Chicago Boyz know each other from student days at the University of Chicago. Others are Chicago boys in spirit. The blog name is also intended as a good-humored gesture of admiration for distinguished Chicago School economists and fellow travelers.
A failure to break an impasse in talks in Washington on Friday opened a new phase in the trade fight after more than five months of back-and-forth negotiations. This time, some economists and analysts said, Beijing is taking stock of potential economic damage from higher tariffs.
The U.S. raised punitive tariffs to 25%, from 10%, for $200 billion in goods leaving China on Friday and thereafter. President Trump also ordered staff to begin the paperwork to impose levies on the more than $300 billion worth of everything else China sells to the U.S.
While Beijing has met previous volleys of tariffs from the U.S. by raising duties on American goods—and the government has promised to retaliate—it held its fire. Though China has more limited tariff options, since it imports fewer products from the U.S. than the other way around, the Chinese leadership is also constrained by an economy that is in a shaky recovery from a sharp slowdown.
The world’s biggest oilseed processor just confirmed one of the soybean market’s biggest fears: China has essentially stopped buying U.S. supplies amid the brewing trade war.
“Whatever they’re buying is non-U.S.,” Bunge Ltd. Chief Executive Officer Soren Schroder said in a telephone interview Wednesday. “They’re buying beans in Canada, in Brazil, mostly Brazil, but very deliberately not buying anything from the U.S.”
In a move that caught many in U.S. agriculture by surprise, China last month announced planned tariffs on American shipments of soybeans.
“China has to resume purchases of U.S. soybeans,” Oil World said in its latest newsletter. “The South American supply shortage will make it necessary for China, in our opinion, to import 15 million tonnes of U.S. soybeans in October 2018/March 2019, even if the current trade war is not resolved.”
China may not be in good shape to handle a trade war.
This month marks the 150th anniversary of the US Transcontinental Railroad… surely one of the most important ‘infrastructure’ projects of all time. Railway Age reprints the contemporary coverage from their predecessor publication, Railway Times.
Union Pacific has completed the restoration of their ‘Big Boy’ steam locomotive, #4014, and will be running it, together with Living Legend #844, from Ogden, Utah to Cheyenne, Wyoming, as part of the transcontinental commemoration.
Gordon Lightfoot’s Canadian Railroad Trilogy is, as the title suggests, about the Canadian transcontinental railroad rather than the American, but is a fitting song for the occasion nonetheless. Also, the Smithsonian website Folklife has a playlist of 20 songs that are in some way related to the transcontinental, with some information about each. (only short samples available unless you have Spotify)
It seems likely that, absent the transcontinental railroad, the United States would not have been able to stay together as a nation on a continental basis–certainly, long-distance transportation technology acts as a centripetal force to counterbalance the many centrifugal forces that tend to separate geographies politically. I’ve previously cited the thoughts of Edward Porter Alexander, a Confederate general turned railroad president, on this topic, while raising the question as to how far this effect can and should extend.
For example, the STEM lesson plan that goes with the Pearl Harbor video is mainly about the attributes of the Zero Fighter . The “social studies” lesson starts with the teacher asking students “Who wants to tell the class what has been happening in Europe since World War I” and “Who wants to tell the class what has been happening in the eastern hemisphere?” (it would be interesting to hear some of the answers) and then progresses to other related topics, including a comparison of FDR’s speech after Pearl Harbor with the speech of GWB after 9/11.
I thought it was an interesting and worthwhile approach. I would have preferred the videos to be a little longer (they’re about 5 minutes each), and thought there were some missed opportunities, misguided emphases, and a few apparent actual errors in some of the lesson plans. For example, the “social studies” piece on the Night Witches (female Russian night bomber pilots) could have included something about the situation in the Soviet Union at the time, and the Eastern Front War in general…same point for The Flying Tank, the video about the Sturmovik ground attack plane. The lesson on the B-17 Ball Turret could have usefully included a link the Randall Jarrell’s brutal poem, Death of the Ball Turret Gunner. The STEM lesson plan on the ME-262 jet fighter talks about the benefits of the swept wing for “balance on its nosewheel”…”it also made the ME-262 faster”–but didn’t really get across the reasons why a swept wing is important as airspeeds get near the speed of sound. The discussion of the Po-2 biplane used by the Night Witches implies that the plane had good gliding capabilities: I seriously doubt this, given the low wing aspect ratio (as noted in the lesson plan) and the high drag generally characteristic of the biplane types. It would glide fine, but not for far…which was appropriate given its mission.
I thought that, overall, this was a very worthwhile effort. The videos were co-produced with Paul Allen’s Vulcan Productions. NBCLearn also has a whole lot of other educational videos.
In my last post — President Trump’s ‘Xanatos Gambit’ Trade Policy — I spoke to how President Trump has set up his political strategy on trade policy to make any outcome on the USMCA Trade agreement that he negotiated to replace the NAFTA agreement would be to his advantage over House Democrats and the “purchased by the multi-national corporation China Lobby” GOP Senators. In this post I am going to lay out President Trump’s “Global Energy Dominance” export policy’s “Xanatos Gambit” strategy tree vis-Ã -vis the 2020 presidential elections.
To start with, I’m going to refer you back to this passage from my last post on how the Trump Administration is “gaming” economic growth measurements:
This is where Pres. Trump’s ‘Xanatos Gambit’ strategy tree kicks in via a macroeconomic and trade policy manipulation of the very simple economic equation of gross domestic product:
GDP = US ECONOMIC ACTIVITY + EXPORTS + FOREIGN INVESTMENT IMPORTS EXTERNAL INVESTMENT
The American economy just grew 3.2% in the 1st quarter of 2019. It would have grown another 0.3% but for the 30-odd day federal government shut down. The “markets” were expecting 2.5% GDP growth. The huge half-percent GDP “miss” boiled down to:
1. The USA exported more.
2. The USA imported less and
3. There was more external foreign investment than expected.
All three were the result of a combination of Trump administration policies on oil/LNG fracking, tax & regulatory cuts and trade/tariffs.
The Trump Administration upon coming into office in January 2017 had a huge windfall of energy projects that the Obama Administration had held up approval of in the Federal Energy Regulatory Commission. This windfall neither began nor ended with theKeystone XL oil pipeline. There was a whole cornucopia of oil and natural gas energy infrastructure projects that Democratic Party interests, only some of them environmental, that the Obama Administration was using the FERC to sit on for a whole lot of reasons that I refer to as “The Economic Cold Civil War.”
While the media was spending a great deal of time talking about things like the Congressional votes to open the Arctic Wildlife Refuge in the early days of the Trump Administration’s energy policy implementation. President Trump spent a great deal of his early political capital on getting his earliest political appointments through the Senate to the FERC to get those projects turned loose as a part of President Trump’s “Global Energy Dominance” export policy. The first fruit of this export infrastructure energy policy focus started paying off with the Louisiana Offshore Oil Port (LOOP) coming on-line in 2018. See this Apr 16, 2019 article by Julianne Geiger at Oilprice.com:
The United States nearly doubled its oil exports in 2018, the Energy Information Administration reporting on Monday, from 1.2 million barrels per day in 2017.
The 2.0 million barrels of oil per day exported in 2018 was in line with increased oil production, which averaged 10.9 million barrels per day last year, and was made possible by changes to the Louisiana Offshore Oil Port (LOOP) which allowed it to load VLCCs (Trent Note: Very Large Crude Carriers) .
The changes to LOOP and to the sheer volume of exports were not the only changes for the US crude oil industry. The destination of this oil shifted in 2018 as well, and even shifted within the year as the trade row between China and the United States took hold.
Overall, Canada remained the largest buyer of US oil in 2018, at 19% of all oil exports, according to EIA data. During the first half of 2018, the largest buyer of US crude oil was China, averaging 376,000 barrels per day. Due to the trade row, however, US oil exports to China fell to an average of just 83,000 barrels per day in the second half, after seeing zero exports to China in the months of August, September, and October.**
[**Please note above the nice thing about energy exports is how futile a energy user embargo is against it. China’s economic embargo of US crude products only hurt itself.]
The impact of the Trump Administration’s energy export policies from those early days of his administration in terms of liquefied natural gas (LNG) export facilities are now impacting the American economy. A large part of the extra 0.7% GDP growth achieved over the 2.5% Wall Street forecasts in the first quarter of 2019 came from the Corpus Christ 1 and Sabine 5 LNG export facilities coming on-line in late 2018 and making their first full export capacity quarter in Jan – Mar 2019. The Cameroon 1 and Elba Island 1-6 LNG export facilities were also scheduled to come on-line in Late Feb-Early March 2019, and were very likely large contributors to LNG export surge.
Robust demand for Texas oil and gas in the first two months of 2019 pushed the state’s export activity into high gear, strongly outpacing the national rate and contrasting with a slight decline by California.
Texas represented nearly 20% of all U.S. exports in the January-February period while California accounted for roughly an 11% share.
California has seen its share of total U.S. exports fall in recent years while Texas has been growing its share due mainly to the new oil boom.
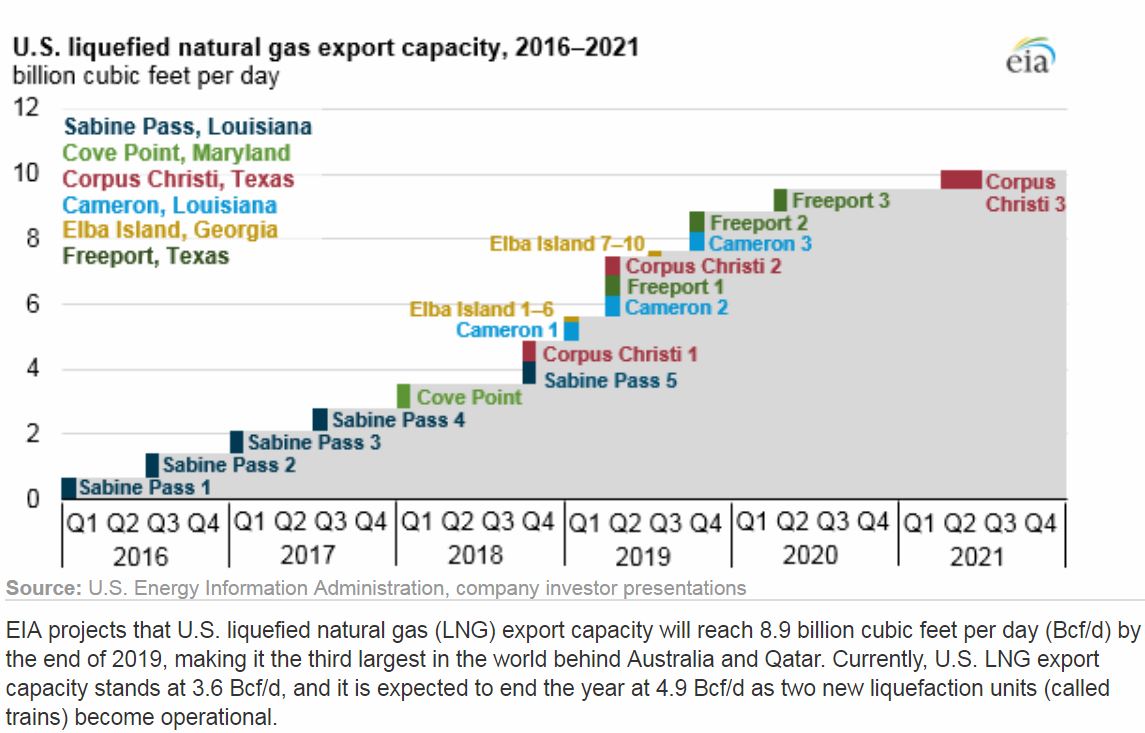
And this is only the beginning for the US economy in 2019. See the following text and LNG export facility graphic from a Dec 10, 2018 report by the US Federal government’s Energy Information Administration:
U.S. LNG exports continue to increase with the growing export capacity. EIA’s latest Short-Term Energy Outlook forecasts U.S. LNG exports to average 2.9 Bcf/d in 2018 and 5.2 Bcf/d in 2019 as the new liquefaction trains are gradually commissioned and ramp up LNG production to operate at full capacity. The latest information on the status of U.S. liquefaction facilities, including expected online dates and capacities, is available in EIA’s database of U.S. LNG export facilities.
EIA projection of U.S. Liquefied Natural Gas Export Capacity from 2016 – 2021. Date of projection, Dec 2018.
Given the above information, barring a war or serious election year intervention to kill the economy by the Federal Reserve, the cascade of LNG export infrastructure coming on-line in the 2nd and 4th quarters of 2019 will mean something on the order of a full percentage increase in GDP growth (in a range of 4.0% to 4.5%) in Jan – Mar 2020 over Jan – Mar 2019. That is what going from 3.6 billion cubic feet per day (Bcf/d) of natural gas export capacity to to 8.9 Bcf/d in Dec 2019 does for you.
This extra 1% GDP will be happening just in time for the Iowa caucuses and New Hampshire primary.